ECON 1P95 Using Big Data to Solve Economic and Social Problems Assignment 1
Hello, dear friend, you can consult us at any time if you have any questions, add WeChat: daixieit
ECON 1P95 Using Big Data to Solve Economic and Social Problems
Assignment 1
Question 1
Study the following boxplots showing population sizes by country:
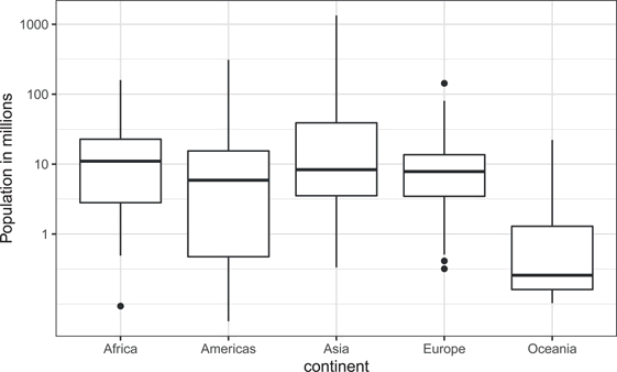
Use the above boxplots to answer the following questions:
(a) Which continent has the country with the biggest population size?
(b) What continent has the largest median population size?
(c) What is median population size for Africa to the nearest million?
(d) If we use a log transformation, which continent shown above has the largest interquartile range?
(e) What proportion of countries in Europe have populations below 14 million? (a) 0.99 (b) 0.75 (c) 0.50 (d) 0.25
Question 2
As mentioned in class, Google Trends data could potentially be used to predict several key economic and social variables. Consider the monthly data on Google searches in Canada using the keywords “cocaine” “crime” and “methamphetamine” for the entire period from January 2004 to September 2021, reported in the Excel file GoogleTrendsCrime.
(a) Use GRETL to obtain the median of each of the three variables. What information does the median provide?
(b) Use GRETL to estimate the coefficient of skewness of each variable and comment on the skewness of each variable.
(c) Use GRETL to compute the pairwise correlations between the three variables: cocaine, crime, and methamphetamine. Comment on the correlations among the three variables and deduce the relationship between each pair of variables.
(d) Based on the results in Part (d), which pair of keywords has the highest correlation?
Question 3
The data reported in the Excel file CrimeSeverity comprises two variables, namely, Severity Index (which represents the non-violent crime severity index obtained from Statistics Canada’s CANSIM database) and Methamphetamine (which represents the Google Trends search index in Canada using methamphetamine as the keyword). The yearly data covers the period from 2004 (the first available Google Trends data) to 2018.
(a) Draw a scatterplot of the relationship between the Severity Index and methamphetamine search intensity index and comment on the relationship between the two variables.
(b) Use GRETL to compute the correlation between the Severity Index and methamphetamine search intensity index and comment on the relationship between the two variables.
(c) Run a simple linear regression of the severity index (the dependent variable) on the methamphetamine search intensity index (the independent variable). Based on this regression results, do you think that the search index is a useful predictor of the severity index? Hint: you could look at the estimated slope coefficient as well as goodness-of-fit as measured by R-squared.
(d) Interpret the R-squared value you obtained in part (c). Hint: R-squared is the percentage of the variation in the dependent variable explained by variation in the independent variable(s).
Question 4
Use the data on after-tax income reported in the Excel file Income.
(a) Use GRETL to draw a histogram (or frequency distribution) of the data, choosing 15 bins, and comment on the results.
(b) Use GRETL to construct a kernel density estimate of the distribution of Income and comment on the distribution? As mentioned in class estimating a density entails choosing a kernel function (choose the normal distribution or Gaussian kernel) and bandwidth (choose automatic selection of bandwidth). Theoretically, the bandwidth determines how smooth the estimated density graph will look. The choice of the kernel function does nor matter i.e. we could choose the Gaussian kernel or another kernel function. For example, GRETL also gives you the option to choose the Epanechnikov kernel.
(c) Do the results in (a) and (b) give rise to the same conclusions about the distribution of income?
(d) Use GRETL to draw Boxplot of the data and comment on the presence of outliers.
(e) Use GRETL to construct a normal Quantile-Quantile (QQ) plot. In doing so, use the sample mean and sample variance for normal quantiles). Based on your inspection of the QQ plot does it look as if the income can be represented by a normal distribution? Briefly explain.
Question 5
As mentioned in class, a contingency table (also known as a cross tabulation or crosstab) is a type of table in a matrix format that displays the (multivariate) frequency distribution of the variables. Contingency tables have many applications, including, survey research, business intelligence, engineering, and scientific research.
Consider the following 2x2 contingency table representing communicable disease status (disease, no disease) and disease exposure (exposed, not exposed)
Disease status
Disease No disease Total
Exposed 12 12 24
Exposure
Not Exposed 11 32 43
Total 23 44 67
(a) Compute the chi-squared statistic by hand and use it to test the null hypothesis of no association between exposure and disease status against the alternative that there is an association between them.
(b) Repeat (a) using an appropriate software (e.g., STATA). The TA will demonstrate how to do this in STATA
Question 6
As indicated in class, the main motivation for using Google Trends data is that the average person will search for information on the internet before taking appropriate action. Hence, Google searches using the keyword “Parks and Recreation” would reflect a happy population that enjoys leisure. Likewise, Google searches using the keyword “Luxury Cars” would reflect a wealthier population that can afford expensive goods. Hence, a study of the relationship between happiness and wealth could be conducted by examining the correlation between the search intensity index for “Parks and Recreation” and “Luxury Cars”.
(a) Use Google Trends search volume related to two keywords, happiness, as measured by the Google search intensity index for “Parks and Recreation” and wealth, as measured by the search intensity index for “Luxury Cars” in Canada from 2004, the earliest date of data availability, to present. Copy and paste the graph as part of the assignment.
(b) Extract the data and compute the correlation between happiness and wealth and use this information to comment on the relationship between happiness and wealth in Canada (i.e., positive relationship, negative relationship or no relationship)
(c) Is the correlation you found in part (b) surprising to you? Briefly explain.
2023-02-23