SCOT 500M, Spring 2023 Operations Analytics: Simulation
Hello, dear friend, you can consult us at any time if you have any questions, add WeChat: daixieit
Operations Analytics: Simulation
Decision Two Guidelines
SCOT 500M, Spring 2023
As you read the case, consider how you would utilize Discrete Event Simulation to model services provided by the company’s tech teams . There are several challenges and issues one has to consider in analyzing the case. The following guidelines should help in developing key assumptions of the modeling process.
The first task is to model the current state. The case provides some information to assist in making assumptions, although the data is incomplete. The key results are that technicians dedicated to traditional servers are utilized more than 90% of the time and customers of traditional severs wait over 2.5 hours, on average, for a technician. Mainframe customers wait one hour, on average, while these technicians face much lower utilization.
1. One important issue to address is the length of each replication in Arena (under Run, Setup). I assumed that each replication is 240 hours. Reflecting a schedule of about 1.5 weeks.
2. Service times for technicians follow an exponential distribution with a mean of 0.8 hours for service (including travel time), for both types of servers. In the current state there are 4 technicians dedicated to traditional servers, and one technician dedicated to mainframes.
3. Instead of analyzing the individual machine, you may assume that service requests are distributed over the course of the simulation trial. In other words, machines are the customers. Arrival times for service follow an exponential distribution.
a. For traditional servers: In a 24 hour period there should be about 114 arrivals. Choose the mean inter-arrival time accordingly (= 0.21 hours). There are 4 technicians.
b. For mainframes: In a 24 hour period there should be about 17 arrivals. Choose the mean inter-arrival time accordingly (= 1.4 hours), with one technician.
c. Growth over the next few years. The increase in mainframes and reduction in traditional servers will impact the inter-arrival times each year. Use the following inter-arrival times to evaluate technician utilization and the waiting time for each time of server:
|
|
Current Year |
Year + 1 |
Year +2 |
Year +3 |
|
Traditional servers |
0.21 |
0.22 |
0.23 |
0.24 |
|
Mainframes |
1.4 |
1.15 |
0.9 |
0.8 |
4. Analyze a single region. From there, you can extrapolate to the entire company.
5. Approach Suggested by Paul Phixitt: implies increasing the number of dedicated technicians for traditional servers in each shift. Find the number of these technicians required to meet the objectives laid out by the committee. Then calculate the implications for increasing technicians in each region and extrapolate to the entire company. Also verify that in the current format, waiting time for mainframes is about 1 hour.
Evaluate the number of technicians of each type needed each year. If needed, increase the number of technicians, of either type, to meet the objectives. Once a technician is added, they should not be reduced in future years.
6. Approach Suggested by the Vice President for Engineering: This implies changing the distribution of service time. Assume a Triangular Distribution for service times. Focus only on the traditional servers. For the base case, assume parameters (0, 0.4, 2.05). This should generate results similar to the base case (with the exponential distribution). Verify this. To model the approach suggested by Engineering, lower only the maximum value of the
distribution to achieve the target. What implications are there for the new technology? Don’t worry about mainframes in this alternative.
7. Approach Suggested by the Chief Financial Officer: In this scenario all technicians are the same and repair both types of servers. There are 5 technicians available to repair traditional and mainframe servers. Evaluate if you need to add technicians in each of the following years, to meet the objectives. Is it true that in the first year, wait time for mainframes increase, because the mainframe technicians also repair traditional servers (as stated by the marketing department)?
8. Approach Suggested by the Vice President for Marketing: At the current staffing levels wait times for mainframes will exceed the target soon. To resolve this problem, they recommend adding a mainframe technician. This is similar to the recommendation by Mr. Phixxit, although less expensive, since only one type of technician is being added. Your answer here can be based on your previous analysis. Is it true that the reduction in traditional servers will shorten wait times sufficiently to meet the targets?
9. Important: see the note on the next page .
10. For the final submission, replicate each simulation for at least 400 trials. However, while developing models use only 50 or 100 replications.
11. Remember to make a final recommendation, comparing alternatives on both quantitative and qualitative factors. A discussion of qualitative factors is an essential part of a comprehensive analysis. Which approach would you recommend to senior management?
Arena – IMPORTANT NOTE
In some simulations Arena will “crash” because too many entities are in the system. You see the following error:
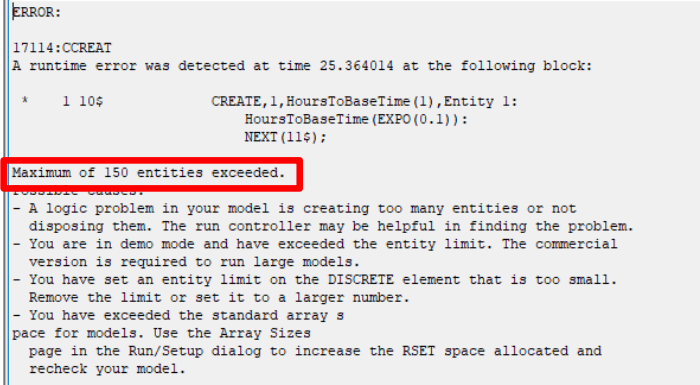
That’s because Arena only allow 150 entities in the system at once. In this case analysis it happens because the utilization rate is too high (above 1). You can check that the utilization rate is close to, or above, 1, by shortening the duration of the simulation to 50 or 100 hours.
For these cases, your answer should be that the utilization rate is greater than 1, and this isn’t a viable alternative.
In some situations, you may get this error only when running Arena on multiple repetitions. If that’s the case, use fewer repetitions.
2023-02-23
Decision Two Guidelines