Mid-terms Take home exam.
Mid-terms Take home exam.
Instructions: Answer ALL questions using R software. Provide all the answers and R code.
1. One would expect a student to be able to guess the answer to 10 items on a 20 item true-false test. The scores for 30 students on a 20 items true-false test are as follows:
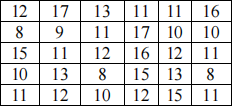
a. State the hypotheses with the hypothesised μ=10.
(1 mark)
b. Test the null hypothesis against the directional alternative hypothesis. Use α=.05.
(5 marks)
c. Interpret the results.
(2 marks)
d. Find the statistical power for the above statistics.
(2 marks)
2. An educational psychologist studied the performance of boys and girls in four different majors in an educational institution. The following data are the performance scores for a random sample of 96 graduating seniors (48 males and 48 females):
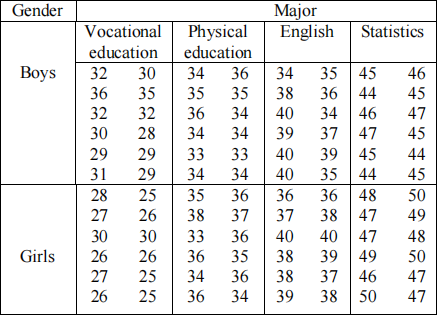
a. Plot the observed data above using an appropriate graph for an exploratory analysis.
(3 marks)
b. The researcher is interested in the performance of boys and girls in the four different majors. Test the appropriate hypothesis using α=.05.
(4 marks)
c. Interpret the results.
(3 marks)
3. An industrial psychologist is interested in the differences between high-performing and low-performing salespeople on several psychological factors. Random samples are selected from two groups of salespeople and a battery of standardised tests is given to each sample. The results of one of the tests are as follows:
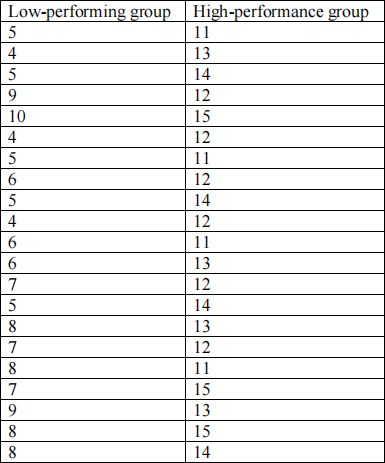
a. Plot the observed data above using an appropriate graph and interpret the graph.
(4 marks)
a) Using R test the null hypothesis using α =.05
(3 marks)
b) Find the statistical power for the above statistics
(1 mark)
c) Interpret the results
(2 marks)
4. A psychology experiment is conducted using 60 young adult males, enrolled in an introductory psychology course. The independent variable is “solution strategy” for solving a concept attainment problem. The solution strategies, labeled below as A, B and C involved in the problem. 10 males are randomly assigned to each strategy; each male solves the problem. The scores for each strategy are given in the table below. Use at the .05(α) significance level.
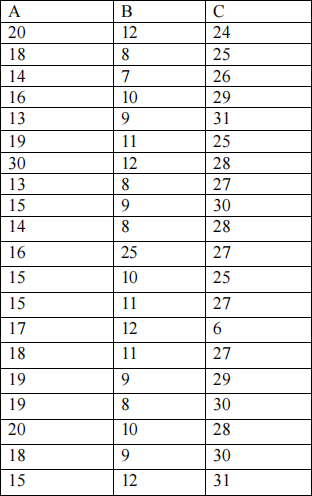
a. Using R develop an appropriate plot to detect outliers and interpret the plot.
(4 marks)
b. After cleaning the data from outliers, using α =.01, provide the ANOVA results.
(3 marks)
c. Compute a post-hoc statistics.
(3 marks)
2021-06-01
Instructions: Answer ALL questions using R software. Provide all the answers and R code.