MAT 234 Practice Exam 1
Hello, dear friend, you can consult us at any time if you have any questions, add WeChat: daixieit
MAT 234
Practice Exam 1
1. The following dot plot represents the number of cars sold at Sid’s and the number of cars sold at Mac’s over 12 weeks.
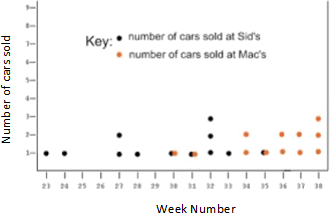
a) What is the population size of each group?
b) Compute the mean, median, and 10% trimmed mean number of cars sold (between 23 and 38 weeks) for both groups.
c) Compute the population variance and standard deviation (number of cars sold between 23 and 38 weeks) for both groups.
2. A study carried out to investigate the distribution of total braking time during driving at 60 km/hr gave the following information on the distribution of times (cite: “A Field Study on Braking Responses During Driving,” Ergonomics, 1995: 1903–1910)
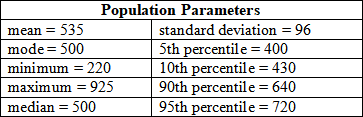
What can you conclude about the shape of a histogram of this data? Explain your reasoning.
3. A certain market has both an express checkout line and a SuperExpress checkout line. Let X1 denote the number of customers in line at the express checkout at a particular time of day and let X2 denote the number of customers in line at the SuperExpress checkout at the same time. Suppose the joint probability mass function of X1 and X2 is as given in the accompanying table.
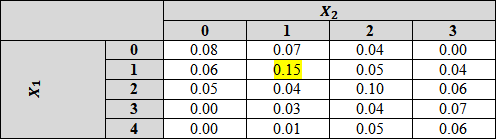
a) What is P ( X1 = 1, X2 = 1), that is, the probability that there is exactly one customer in each line?
b) What is P ( X1 = X2), that is, the probability that the numbers of customers in the two lines are identical?
c) Let A denote the event that there are at least two more customers in one line than in the other line. Express A in terms of ![]() and
and ![]() , and calculate the probability of this event.
, and calculate the probability of this event.
4. The following data represent the length of life in years, measured to the nearest tenth, of 30 similar cell phone batteries:
|
1.1 |
1.5 |
2.7 |
|
1.2 |
1.5 |
2.8 |
|
1.2 |
1.7 |
2.8 |
|
1.2 |
1.8 |
2.9 |
|
1.2 |
2.1 |
3.1 |
|
1.3 |
2.1 |
3.1 |
|
1.3 |
2.2 |
3.2 |
|
1.3 |
2.3 |
3.3 |
|
1.4 |
2.4 |
3.4 |
|
1.5 |
2.6 |
3.5 |
a) Construct a stem-and-leaf plot for the life in years of the cell phone batteries, using the digit to the left of the decimal point as the stem for each observation and the digit to the right of the decimal point as the leaf.
b) Set up a relative frequency distribution.
c) Compute the sample mean, sample range, and sample standard deviation.
d) Construct a relative frequency histogram of the data.
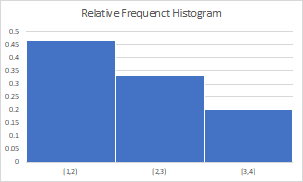
e) Comment on whether there is any clear indication that the sample came from a population that has a bell-shaped distribution.
5. Consider randomly selecting a single individual and having that person test drive 3 different vehicles. Define events ![]() by
by ![]() ;
; ![]() ;
; ![]() . Suppose that
. Suppose that ![]() ,
, ![]() ,
, ![]() ,
, ![]() , and
, and ![]()
a) What is the probability that the individual likes both vehicle 1 and vehicle 2? ![]()
b) Determine and interpret P(A2 | A3)
c) Are ![]() and
and ![]() independent events?
independent events?
d) If you learn that an individual did not like vehicle 1, what is the probability that she liked at least one of the other two vehicles?
6. If A and B are independent events, show that A![]() and B are also independent. [Hint: First establish a relationship between
and B are also independent. [Hint: First establish a relationship between ![]() .]
.]
7. In the senior year of a high school graduating class of 100 students, 42 studied mathematics, 68 studied psychology, 54 studied history, 22 studied both mathematics and history, 25 studied both mathematics and psychology, 7 studied history–but neither mathematics nor psychology, 10 studied all three subjects, and 8 did not take any of the three. Randomly select a student from the class and find the probabilities of the following events.
a) A person enrolled in psychology takes all three subjects.
b) A person not taking psychology is taking both history and mathematics.
8. How many distinct permutations can be made from the letters of the word INFINITY?
9. A box contains 500 envelopes, of which 75 contain $100 in cash, 150 contain $25, and 275 contain $10. An envelope may be purchased for $25. What is the sample space for the different amounts of money? Assign probabilities to the sample points and then find the probability that the first envelope purchased contains less than $100.
|
100 |
75 |
0.15 |
|
25 |
150 |
0.30 |
|
10 |
275 |
0.55 |
10. The total number of hours, measured in units of 100 hours, that a family runs a vacuum cleaner over a period of one year is a continuous random variable X that has the density function
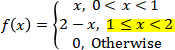
Find the probability that over a period of one year, a family runs their vacuum cleaner
a) less than 120 hours;
b) between 50 and 100 hours.
11. The Joint Probability Mass Function of X and Y is
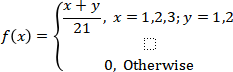
Find.
a) P (X ≤ 2, Y = 1)
b) P (X > 2, Y > 1)
c) P (X > Y)
d) P (X + Y > 2)
12. Consider the following joint probability density function of the random variables X and Y:
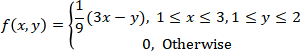
a) Find the marginal density functions of X and Y.
b) Are X and Y independent?
c) Find P(X > 2)
13. A store carries AA batteries and has a sale on 12 packs. If Y = {the amount of AA batteries in a pack}, then the probability mass function is:
|
|
2 |
4 |
8 |
12 |
18 |
|
|
0.05 |
0.08 |
0.17 |
0.45 |
0.25 |
Find the cumulative distribution (mass) function F(y).
14. The distribution of the number of plain hamburgers (in 10,000’s) sold by a McDonald’s franchise in a given day of the week is a continuous Random Variable X with ![]()
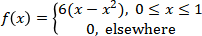
Find the cumulative distribution function F(y).
2023-02-21