Econ 20A Problem Set 2
Hello, dear friend, you can consult us at any time if you have any questions, add WeChat: daixieit
Problem Set 2
Econ 20A
Due date: Feb 27
1) In December 2008, in the midst of the Great Recession, some economists were forecasting deflation for the coming year. Suppose in December 2008 a borrower who expects an inflation rate of -0.4% borrows $1,000 for one year at a nominal interest rate of 4.2%.
a) How much will the borrower need to pay at the end of the year?
b) What real interest rate was the borrower expecting to pay on the loan?
c) The actual inflation rate between December 2008 and December 2009 was positive, at 1.5%. What real interest rate did the borrower actually pay on the loan?
2) Using the FRED economic database (https://fred.stlouisfed.org/), let’s compare the GDP of the state of California with that of some countries, in this case, France and Canada. Because France’s GDP is in euros and Canada’s is in Canadian dollars, we will need to convert currencies. In addition, we would like to compare GDP over a similar basket of goods. Comparisons like this are called purchasing power parity (PPP) comparisons. After you have found real GDP for California, click Edit Graph, then click Add Line and find real GDP for France, looking for a series like “Expenditure-side Real GDP at Chained Purchasing Power Parities for France.” Now click Add Line again and find a similar series for Canada.
a) How do California, France, and Canada compare? What does this suggest about the U.S. economy and its role in the world economy?
b) Using Google, find the population of each of these regions and then do a back-of-the- envelope calculation of real GDP per capita in, say, 2014 in each entity.
3) Consider the table below containing data for Germany and Japan on the ratio of employment to population in 1980 and 2010.
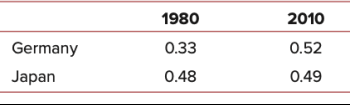
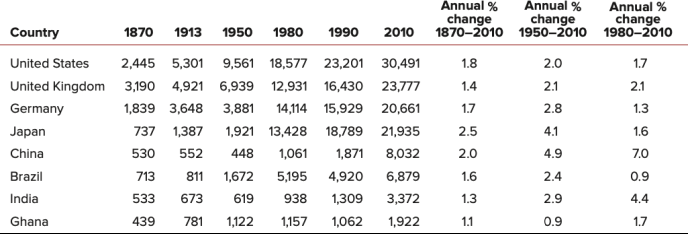
Using data on real GDP per person from table below, find average labor productivity for each country in 1980 and 2010. How much of the increase in output per person in each country over the 1980 to 2010 period is due to increased labor productivity? To increased employment relative to population?
4) If the government of a poor catch-up country is trying to decide whether to encourage investment or encourage research and development, which of the two should it favor? (Note: In a world of trade-offs, you can’t just say “Both are important!”)
5) Using information below, find government expenditure, private saving, and investment. GDP = 6,000, Tax collections = 1,200, Government transfers = 400, Consumption = 4,500, Government budget surplus = 100
6) Suppose GDP is $8 trillion, taxes are $1.5 trillion, private saving is $0.5 trillion, and public saving is $0.2 trillion. Assuming this economy is closed, calculate consumption, government purchases, national saving, and investment.
7) Read the article "Why nations fail, America Edition" to answer:
a) What are characteristics of inclusive/extractive institutions?
b) How might the deep factor of institutions cause a decline in the prosperity of Americans?
8) Read the article "Explained: Why India's economy is more resilient than rest of the world" to answer:
a) Each factor of India's economic resilience contributes towards which component of increase in GDP pc, employment ratio or productivity? If the latter, which determinant of productivity?
b) How lower debt of the government in India might contribute to its economic growth?
2023-02-21