STAT 230 Assignment 1
STAT 230 Assignment 1
DUE: Friday May 28 by 3PM EDT
INSTRUCTIONS
Submission: Your Assignment will be submitted in Crowdmark. Before submitting, make sure all pages are uploaded to the correct location, are rotated correctly, and are clear to read. Failure to do any of the above may result in your solution not being marked.
For help on successfully completing and submitting assignments on Crowdmark, see this tutorial.
Presenting your work: You may type out your work in a text editor such as Word or equation editors such as LaTeX or RMarkdown. You may also submit scans/photographs of handwritten work. If you choose this option, ensure your work is clear and easy to read. A combination of typed out and handwritten work is also acceptable.
You must present all R commands you used and their outputs. Someone reading your work must be able to take your commands, copy them into R, and obtain identical results. You must clearly indicate your final answer to each of the questions (presenting R output without clearly indicating what number represents your final answer will not be awarded full points).
Final numerical answers must be presented with at least 3 significant digits after the decimal point. E.g. 0.000120. Be careful not to round intermediary results as this could affect the correctness of your final answer. E.g. 0.12345/0.23456 = 0.526, while rounded numbers give a different, incorrect answer of 0.123/0.235 = 0.523.
External resources: Collaboration is not permitted on the assignments. You must work individually. Discussing or sharing any part of the assignment on forums or websites is not permitted. Public posts on Piazza regarding general R coding questions is permitted, whereas public posts regarding actual assignment questions is not permitted. Accessing the course materials on LEARN is permitted as well as accessing external websites for general R learning.
Using R: The assignment consists of parts to be solved theoretically and parts to be solved using R. Parts to be solved with R are explicitly identified. Please refer to the R tutorial on LEARN for relevant R material. The R tutorial contains all the necessary commands to complete the assignment. If you wish, you may use commands or packages that are not presented in the R tutorial. E.g. for loops.
QUESTION 1 [18 marks] Plenty of Fisher
Pavlov is an eligible bachelor despite his best efforts. To figure out why, he turned to the only logical place: mathematics. Per his estimates, only 1 in 10001 women would make for a suitable partner for him. In his quest to find “The One”, he signed up on a matchmaking service, Plenty of Fisher 2 . He answered their survey regarding the qualities he’s searching for in a partner.
Plenty of Fisher came up with a test to help identify a suitable partner. Plenty of Fisher would screen its database of eligible women and correctly identify a worthy partner 95% of the time. It is a very accurate screening. Plenty of Fisher does make mistakes, however, in the form of false positives. In fact, 1 in 100 would be incorrectly labelled as a suitable partner.
There are two measures of the effectiveness of a test like this. The sensitivity of a test (TPR or true positive rate) is the probability that the test result is positive given that an individual is a suitable partner. The specificity (TNR or true negative rate) is the probability that the test result is negative given that an individual is not a suitable partner. Therefore, a good test would have TPR and TNR values close to one.
a) [2 marks] Let A be the event “participant passes screening” and B be the event “participant is a suitable partner.” Define the sensitivity and specificity in terms of the probability function P(·) and the events A and B.
b) [4 marks] Find the probability that a randomly selected Plenty of Fisher member passes the screening.
c) [2 marks] Find the probability that a Plenty of Fisher member is a suitable partner given that they passed the screening.
d) [10 marks] Upon finding out the proportion of participants that passed the initial screening, Pavlov realized that it is still too high. He requested Plenty of Fisher’s help and they agreed to conduct another independent screening with the same sensitivity and false positive rates as before. Assume that the screening results are independent.
(i) [4 marks] Let passi be the event that a particular individual passes the i th screening. Find P(pass2|pass1), the probability that an individual passes the second screening given that they passed the first screening.
(ii) [2 marks] Compare the probability from part (i) with the probability of passing the first screening only. Which is larger? Does this make sense in light of the screenings being independent? Explain.
(iii) [4 marks] Write a function in R that computes P(pass2|pass1) as a function of P(B) and plot it on the sequence of points grid given below. Comment on what you see.

Addendum
This question extends beyond Pavlov’s reproducibility to a much more critical problem: reproducibility in science.
We can frame scientific inference in the following terms:
• We have a hypothesis, and it is either true or false; (Someone is a suitable partner or is not)
• We get a statistical cue regarding the falsity of the hypothesis; (The screening)
• We use Bayes’ theorem to quantify the impact of the cue on the status of the hypothesis. (Finding P(B|A))
The above demonstrates that if the prevalence of a true hypothesis is small (which historically speaking appears to be the case), having a test that finds almost all true hypotheses is still no guarantee that a positive test result carries a lot of information. This is attributed to the fact that most positive results are false positives.
Since perfect tests do not exist, we should strive to conduct experiments that are both replicable and repeatable (and perhaps attempt to reduce the prevalence of false hypotheses through non-statistical means).
QUESTION 2 [34 marks] Hearthstone Arena
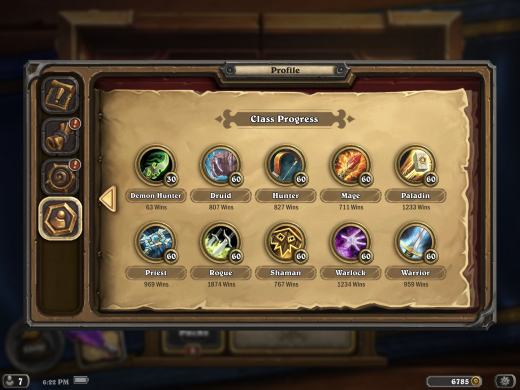
Pavlov is an avid Hearthstone player3 . Hearthstone is a digital, turn-based strategy card game set in the Warcraft universe. Pavlov’s favourite game mode is the arena, where each game begins by choosing from one of 3 randomly selected classes coming from a pool of 10 classes in total. The order in which the classes appear does not matter.
The classes can be partitioned according to three tiers based on their average win rate in games. The following table displays the tiers:
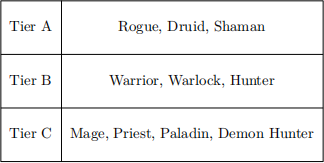
We can simulate Pavlov’s arena games by using the sample() function as follows.
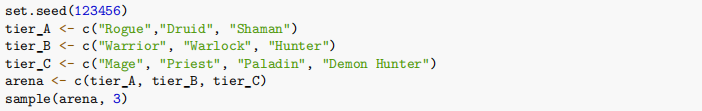
## [1] "Demon Hunter" "Rogue" "Hunter"
The set.seed() function ensures that our simulation results are replicable. For more information, try running the set.seed command in the console.
a) [1 mark] What is the size of the sample space?
b) [2 marks] Calculate the probability that a randomly selected arena game would have a single class from every tier?
c) [12 Marks] In this part, we use R to simulate arena games to estimate desired probabilities.
(i) [4 marks] Using R, simulate Nsim = 10, 000 arena games by first setting the seed to 1234 and print the first 6 arena games by using the head() command on your arena games.
(ii) [2 marks] The %in% function is a binary operator in R which allows us to check which values in one vector are present in another. Look up the syntax for %in% in R by running the ?%in% command and use it to check which of the first 6 arena games have a Warlock in them.
(iii) [2 marks] Write a function check_for_all_tiers(arena_game) in R which checks if all three tiers are present in an arena game.
(iv) [4 marks] By using the function you created in part (iii) and your simulated 10,000 arena games from part (i), find the proportion of arena games where a class from every tier is present. Do these results agree with part b)? Explain.
d) [12 marks] Pavlov’s favourite class is the Rogue. If the Rogue is present, Pavlov is conditioned to pick it.
(i) [4 marks] Estimate the probability that Pavlov’s next arena game has a Rogue given that at least one of the classes is in Tier A by using your simulation from part c) (i).
(ii) [4 marks] Estimate the probability that Pavlov’s next arena game has a Rogue given that at least one of the classes is in Tier B by using your simulation from part c) (i).
(iii) [4 marks] Compare the two probabilities from parts (i) and (ii). Which is larger and why does this make sense?
e) [7 marks] Blizzard, the developers and publishers of Hearthstone, are notorious for their game-breaking bugs. Assume that a developer accidentally released a bug where the 3 classes are picked with replacement from the pool of 10.
(i) [3 marks] Find the probability that a class from every tier would appear in an arena game.
(ii) [4 marks] By using any of the code from previous questions (with any necessary adjustments), use R to simulate Nsim = 10, 000 bugged arena games with seed set to 1234. Check your answer from part (i) by comparing it to the appropriate proportion in your simulation.
QUESTION 3 [23 marks] Gambling with dice: That’s how I roll
Charlie and Sheen love gambling with dice. Their favourite game is HighRoller. The game is played as follows: Charlie rolls a fair die 4 times, and if he rolls at least one six, he wins a dollar from Sheen. Otherwise, he gives Sheen $1. Assume that all rolls are independent of each other.
a) [3 marks] Compute the probability that Charlie wins. Is the game fair, or does someone have an advantage? Explain.
b) [4 marks] Simulate Ngames = 10,000 games and set the seed to your student number. Find the proportion of games that Charlie would win.
c) [16 marks] Eventually, Sheen grew tired of losing. He proposed that they change the game slightly. For a fixed positive integer n, Charlie would roll two fair dice n times. If Charlie rolls a double six within the n rolls, he wins $1, and otherwise, he loses $1.
(i) [3 marks] Determine the probability (as a function of n) that Charlie wins this game.
(ii) [5 marks] Write a function called double_six(n) in R that computes the probability that Charlie wins this game as a function of n. Evaluate it at n = 10, 20, and 30.
(iii) [4 marks] Using R, plot double_six(n) on the grid n ∈ {1, 2, . . . , 50}.
Comment on the monotonicity of the function.
(iv) [4 marks] Using R, find the largest positive integer n for which double_six(n) < 0.5.
Addendum
We saw that Sheen eventually refused to gamble with Charlie even though the game was only slightly in Charlie’s favour. Why might Sheen agree to gamble in double six with the value of n from part (iii) even though it is such a minuscule difference?
Let’s examine a slightly more extreme example where Charlie and Sheen are playing one of two unfair games. Under gambling scheme 1, Charlie has a probability of 60% of winning any given gamble. Under gambling scheme 2, Charlie has a probability of 40% of winning any given gamble. Moreover, suppose that all gambling outcomes are independent of one another and that they each agree to play a gamble 30 times.
The following code will allow you to simulate the scenarios described above and
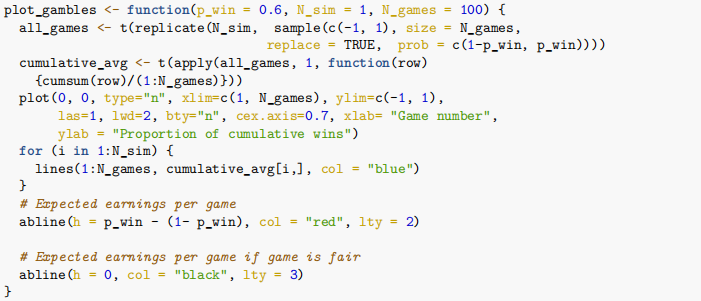

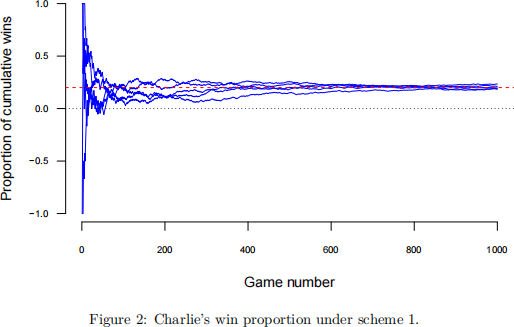

As we can see in the plots, under gambling scheme 1, Charlie’s proportion of games won is concentrated around
(1) ∗ 0.6 + (1) ∗ (0.4) = 0.2.
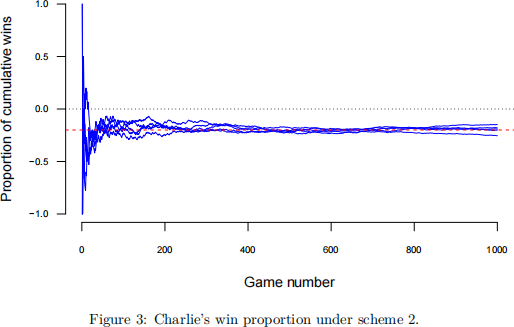
In scheme 2, Charlie’s proportion of games won is concentrated around
(−1) ∗ 0.6 + (1) ∗ (0.4) = −0.2.
If we multiply it by games played, this would mean that
• under scheme 1, Charlie would have likely won around $200,
• under scheme 2, Charlie would have likely lost around $200.
In Chapter 10, we will see that the more games that Charlie plays, the closer his proportion of games won gets to the expected proportion of games won.
2021-05-31