Equilibrium: Measurement of equilibrium constant.
Hello, dear friend, you can consult us at any time if you have any questions, add WeChat: daixieit
Equilibrium: Measurement of equilibrium constant.
|
INTRODUCTION |
The purpose of this experiment is to determine the equilibrium constant, Kc, for the following
chemical reaction: Fe3 +(aq) + SCN– (aq) ![]() FeSCN2+ (aq)
FeSCN2+ (aq)
iron(III) thiocyanate thiocyanoiron(III)
When Fe3+ and SCN- are combined, equilibrium is established between these two ions and the FeSCN2 + ion. In order to calculate Kc for the reaction, it is necessary to know the concentrations of all ions at equilibrium: [FeSCN2+]eq, [SCN–]eq, and [Fe3+]eq. You will prepare four equilibrium systems containing different concentrations of these three ions. The equilibrium concentrations of the three ions will then be experimentally determined. These values will be substituted into the equilibrium constant expression to see if Kc is indeed constant.
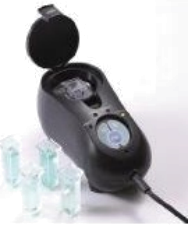
In order to determine [FeSCN2 +]eq, you will use the Colorimeter shown in Figure 1. The FeSCN2+ ion produces solutions with a red color. Because red solutions absorb blue light very well, the blue LED setting on the Colorimeter is used. A higher concentration of the colored solution absorbs more light (and transmits less) than a solution of lower concentration. The Colorimeter monitors the light received by the photocell as either an absorbance or a percent transmittance value.
The computer-interfaced Colorimeter measures the amount of blue light absorbed by the colored
solutions (absorbance, A).
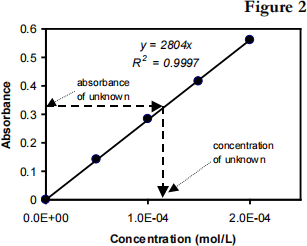
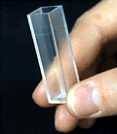
You are to prepare five solutions of known [FeSCN2+] concentration (standard solutions). Each is transferred to a small, rectangular cuvette that is placed into the Colorimeter. The amount of light that penetrates the solution and strikes the photocell is used to measure the absorbance of each solution. When a graph of absorbance vs. concentration is plotted for the standard solutions, a direct relationship should result, as shown in Figure 2. The direct relationship between absorbance and concentration for a solution is known as Beer’s law:
A = a b c
Here A is absorbance, b is the path length (width of a cell, you will use a 1.00-cm cell), c is the sample concentration and a is the molar absorptivity in units of M-1cm-1 . The concentration of an unknown solution is then determined by measuring its absorbance with the Colorimeter. By locating the absorbance of the unknown on the vertical axis of the graph, the corresponding concentration can be found on the horizontal axis (follow the arrows in Figure 2). The concentration of the unknown can also be found using the slope (a×b) of the Beer’s law plot:
Absorbance, A = a b [FeSCN2+].
Since b = 1.00 cm, then:
[FeSCN2+] eq = A eq /a (1)
Knowing the [FeSCN2 +]eq allows you to determine the concentrations of the other two ions at equilibrium.
For each mole of FeSCN2 + ions produced, one less mole of Fe3+ ions will be found in the solution (see
the 1:1 ratio of coefficients in the equation above). The [Fe3+] can be determined by:
[Fe3+]eq = [Fe3+]i – [FeSCN2+]eq (2)
Because one mole of SCN- is used up for each mole of FeSCN2 + ions produced, [SCN–]eq can be
determined by:
[SCN–]eq = [SCN–]i – [FeSCN2+]eq (3)
Knowing the values of [Fe3+]eq, [SCN–]eq, and [FeSCN2+]eq, you can now calculate the value of Kc, the
equilibrium constant.
|
PROCEDURE |
This is apartnership experiment.
Part 1. Beer’s Law.
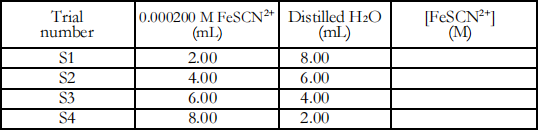
Step 1. Label four clean, dry 18 × 150 mm test tubes with labels S1, S2, S3 and S4. Obtain about 30 mL of standard 0.000200 M FeSCN2+ solution. No need to measure the 30 mL accurately with graduated cylinder.
Step 2. Pipet 2.00, 4.00, 6.00, and 8.00 mL of 0.000200 M FeSCN2 + standard solution into Test Tubes S1,S2,S3 and S4, respectively. Pipet 8, 6, 4, and 2 mL of distilled water into Test Tubes S1,S2,S3 and S4, respectively. Thoroughly mix each solution. Volumes and concentrations for the trials are summarized below:
Step 3. Prepare the computer for data collection by opening the file Equilibrium. You should see a live Meter window to display absorbance, and a Table window with columns for the trial number and the absorbance value.
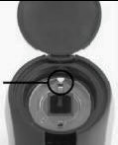
Step 4. Select wavelength 470 nm and calibrate the Colorimeter with a cuvette filled 3/4 full with distilled water (blank sample). Make sure the sample in the cuvette is free of bubbles. The cuvette should be wiped clean and dry on the outside with a Kimwipe. Line up one of the clear sides of the cuvette with the arrow at the top of the cuvette slot and insert the cuvette. Close the Colorimeter lid. Next, press the CAL button to begin the calibration process. Release the CAL button when the red LED begins to flash. The absorbance should now be 0.000. When the LED stops flashing, the calibration is complete and your unit is ready to collect data.
Step 5. Rinse the cuvette twice with small (1-mL) portions of the Test Tube S1 solution. Wipe the outside of the cuvette with a Kimwipe and then place the cuvette with the solution from Test Tube S1 in the Colorimeter. After closing the lid, wait for the absorbance value to stabilize. Then click Keep and type “S1” (the trial number) in the edit box, and OK.
Step 6. Discard the cuvette contents. Repeat Step 5 to find the absorbance of the
solutions in Test Tubes S2, S3, S4. Type the Test Tube numbers into the edit box. Also find the absorbance of the original (0.000200M) standard solution and type “S5” in the edit box and press OK. From the Table window, record the absorbance values for each of the five trials in your data table. Step 7. Use MS Excel to plot a graph of absorbance vs. concentration. Fit the data points with a line. In the format Trendline, Option menu set intercept = 0. Record the equation of the linear fit in the Table. Save the graph and attach it to your lab report.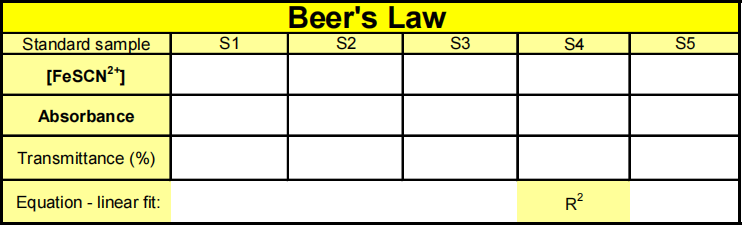
|
Part 2. Measurement of an equilibrium constant |
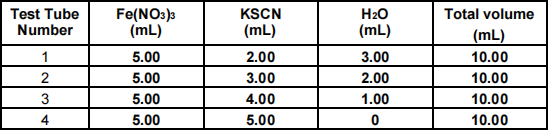
Step 1. Clean the test tubes used in Part 1 and attach new labels 1-4. Using a bottle-top dispenser add 5.00 mL of 0.00200 M Fe(NO3)3 solution to each of the four labeled test tubes.
Fe(NO3)3 solutions in this experiment areprepared in 1 M HNO3 and should be handled with care.
Step 2. Pour about 25 mL of the 0.00200 M KSCN into a clean, dry 100-mL beaker. Pipet 2, 3, 4 and 5 mL of this solution into Test Tubes 1-4, respectively. Obtain about 25 mL of distilled water in a 100-mL beaker. Then pipet 3, 2, 1 and 0 mL of distilled water into Test Tubes 1-4, respectively, to bring the total volume of solution in each test tube to 10 mL. Mix each solution thoroughly with a stirring rod or using a test tube touch mixer. Be sure to clean and dry the stirring rod after each mixing. Measure and record the temperature of one of the solutions. Volumes to be added to each test tube are summarized here:
Step 3. Rinse the cuvette twice with small (1-mL) portions of the Test Tube 1 solution. Wipe the outside of the cuvette with a Kimwipe and then place the cuvette with the solution from Test Tube 1 in the Colorimeter. After closing the lid, wait for the absorbance value to stabilize. Then click Keep and type “1” (the trial number) in the edit box, and OK.
Step 4. Discard the cuvette contents into a 30-mL beaker. Repeat Step 6 to find the absorbance of the solutions in Test Tubes 2, 3, 4. Type the Test Tube numbers into the edit box. Record the absorbance values for each of the four trials in your data table. When you are done close the Logger Pro program.
|
CALCULATIONS |
1. Calculate the initial concentration of Fe3+, based on the dilution that results from adding KSCN
solution and water to the original 0.00200 M Fe(NO3)3 solution. See Part2, Step 2 of the procedure
for the volume of each substance used in Trials 1-4. Calculate [Fe3+]iusing the equation:
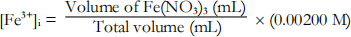 (5)
(5)
2. Calculate the initial concentration of SCN– , based on its dilution by Fe(NO3)3 and water:
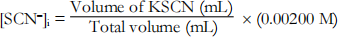 (6)
(6)
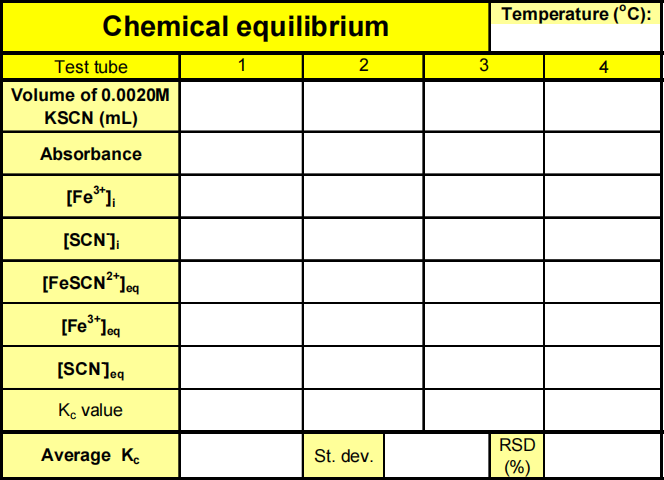
3. Use Eqs (1-3) to calculate the values of [FeSCN2+]eq. , [Fe3+]eq and [SCN–]eq. Then calculate the
value of Kc. Show the Kc expression and sample calculations.
Hint : From Eq. (1) calculate the concentrations ofions for each ofthefour trials. Aeq are the absorbance values
for the equilibrium test tubes.
4. Using your four calculated Kc values, determine an average value for Kc and its standard deviation.
2023-02-18