PSY2116 Assignment
PSY2116 Assignment
1 Handing in the assignment
Please submit your assignments on BrightSpace before the deadline (listed above).
2 Instructions
This assignment will allow you to practice conducting statistical analyses as a researching psychologist. As you recall from class, prior to conducting a study you need to ask a question that interests you. I provide an example below, but you are instructed to create your own versions of interesting questions to ask and to test using the supplied data.
You have been provided unique data sets so your statistics and answers must be done on the data set that is assigned to you. A unique answer key will be made for each data set and available to the TA to help them mark the assignments. If your answers do not match the answer key, you will not receive a full mark.
As discussed in class, hypothesis testing involves 4 steps.
1. Ask a question about the population and state the hypothesis
2. Use hypothesis to predict sample characteristics
3. Obtain sample, collect data, and perform statistical analyses
4. Compare result to prediction and make a decision
3 Statistical tests you need to conduct
You are required to come up with interesting questions/hypotheses for each of the tests below and perform the following statistical tests to address the questions. Please make sure that you are creating a unique question for each question. Get creative and make this activity fun for yourself. You can come up with silly and even unrealistic scenarios.
4 Questions
1. Perform a 1 sample t-test, 2-tailed, α = 0.05, and summarize your results (5 points)
2. Perform a repeated samples t-test, 2-tailed, α = 0.05, and summa-rize your results; Calculate Cohen’s d and report it in the conclusion (10 points)
3. Perform a 2-sample independent samples t-test, 2-tailed, α = 0.05, and summarize your results; Calculate the 95% Confidence Intervals around the mean difference and report them in the conclusion (10 points)
4. Perform a 1-way ANOVA, 2-tailed, α = 0.05, on the 3 variables and summarize your results; show results for pairwise comparisons (10 points)
For each question, show plot(s) of your data and write your conclusion/summary in APA format. If you are asked to report Cohen’s d or CIs, you may need to calculate these manually (or in R).
5 Example – 2-sample independent t-test, 2-tailed
5.1 Question/hypothesis
We would like to determine whether the resting heart rate (RHR) of students in PSY2116 is normal compared to the general population of University of Ottawa students. The reason that we are asking this question is because we want to know whether Dr. Konar is causing PSY2116 students to have heart condi-tions that may result in a different RHR compared to the population of all the University of Ottawa students.
To conduct the study and to test our hypothesis, we take a sample of 20 students from each population, n1 = 20 from PSY2116 and n2 = 20 from stopping students on campus at various locations and at different times to get a good representative random sample. We measure the RHR of each participant from both samples and record it (this is equivalent to the data stored under ‘V1’ for sample 1 and ‘V2’ for sample 2).
Having measured the RHRs for all participants, we want to test our hypoth-esis that PSY2116 students have a different mean RHR compared to the general population because we suspect that Dr. Konar is causing students stress, which may present as a different RHR.
When writing up my results, it helps to organize my thoughts using the sequence of steps we learned when conducting a hypothesis test.
5.2 Hypothesis test
Hence, my first step is to state my null and alternative hypotheses. The null hypothesis in this study is that Dr. Konar is not causing heart issues in his students and that the average RHR of PSY2116 students is not different from the general population of students at the University of Ottawa. The alternative hypothesis is that Dr. Konar is causing heart issues in PSY2116 students and thus their RHRs are different from the mean of the general population. Given that we are conducting a 2-tailed test, note the way I structured the formulaic version of the hypotheses:
•

•

You have the option of stating your hypotheses in words, as in the previous paragraph, or formulaically, as is seen right above this sentence.
For the 2nd step, I want to figure out the criteria for accepting or reject-ing my null hypothesis. For this, I will determine my tcritical using a table. Alternatively, I can rely on R’s built-in function that I will show below.
For the 3rd step, we collect data (this was done for us already) and run the appropriate statistical analyses. Here, we calculate whether there is a significant difference between our sample data and the population, whether this difference is meaningful (e.g., Cohen’s d), and use an interval estimate of the population mean (e.g., Confidence Intervals) instead of a point estimate (i.e., sample mean).
For the 4th and final step, we make a decision after comparing tobserved to tcritical, and write our results in an APA format. Further, we report our effect size to supplement our t-test in order to determine whether the difference (if significant), was meaningful. Further, using Confidence Intervals, we can state how likely our mean is in relation to the population mean.
6 Your data set
Once you download the file ‘PSY2116-ClassData.zip’ from BrightSpace, you have to unzip it.
• On Windows, note the directory where you are saving the file. In that directory, you can right-click on the file and choose Extract All; then pick a folder where you want the data to be placed. Pressing ‘Enter’ will just unzip in the same folder.
• On OSX, note the directory where you are saving the file. If you double-click on the ‘PSY2116-ClassData.zip’ file, it should extract in the same directory in the Finder.
• I haven’t done this on Linux in a long time, so if you cannot figure this out, please come see me and we’ll sort it out. I’m guessing if you are using Linux, this step is a non-issue.
Find your student number among the files. This PSY2116 ∗.CSV file is your data set (your student # is in place of the *, obviously).
Once you open your data file, it will include 3 columns of randomly generated numbers. The column names are ‘V1’, ‘V2’, and ‘V3’. There are 20 rows of data in each column. If you are asked to conduct an analysis on 1 sample, then use column 1 titled ‘V1’. If you are asked to conduct an analysis on 2 samples, then use columns 1 and 2 titled ‘V1’ and ‘V2’. Finally, when you are asked to do a 1-way ANOVA, you will use all 3 columns for this analysis.
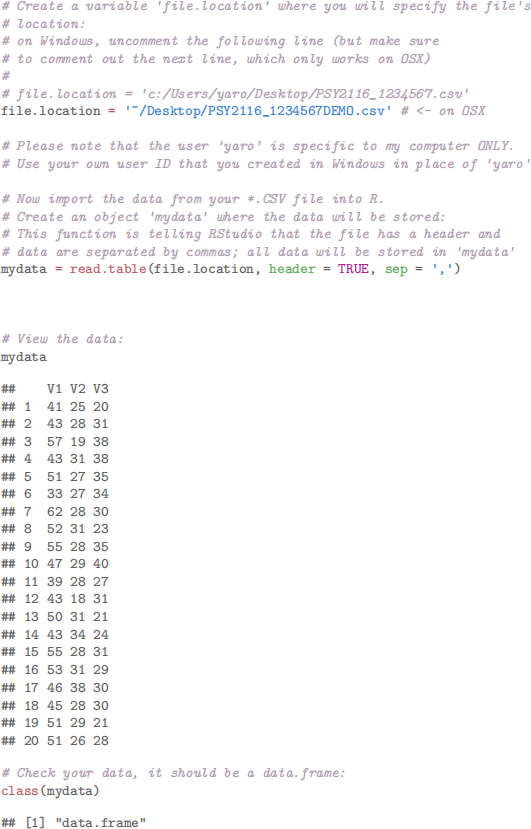
The ‘PSY2116-ClassData.zip’ file also includes the file ‘PSY2116 1234567.csv’. I will be using the data from this file to demonstrate analyses in R. You can mimic how I do the analyses on this file and cater it to your data. Do NOT use the data from ‘PSY2116 1234567.csv’ as your own data. This file is for demonstrative purposes only.
7 Getting data into R
To import your data set into R, you have to follow a few steps that I will outline below.
Assume that I saved the data file (‘PSY2116 1234567.csv’) on my Desktop. To import it into RStudio, open RStudio first. Then choose File, New File, New R Script. All your work will be entered and stored here. Make sure to save this R script as something you’ll recognize, e.g., ‘PSY2116 Assignment.R’. Now enter the following commands into RStudio. Remember, to execute each line of code in RStudio. Windows: use Ctrl-Enter on the line of code that you would like to execute; OSX: use Command-Enter. Linux: hopefully you can figure this out; if not, talk to me and we’ll figure it out together.
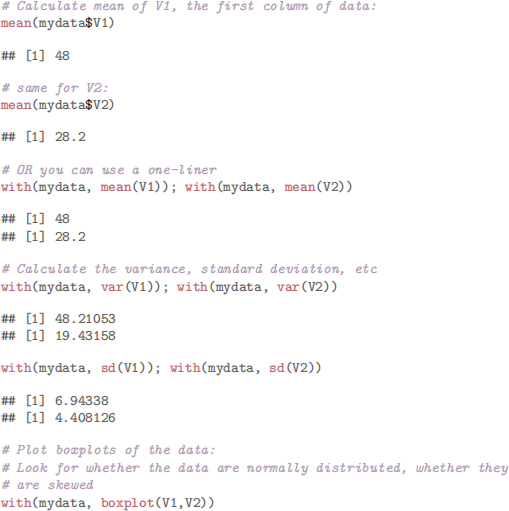
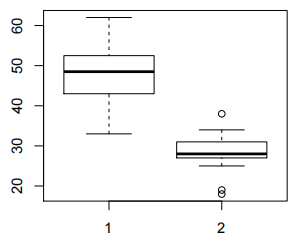
Now spend some time familiarizing yourself with the data. You can do quick descriptive stats and some plots to visualize the data.
Next, we want to do a 2-sample t-test on the imaginary data. For that I will use the first 2 columns, where V1 will be the data for PSY2116 students and V2 will be data for the sample from the general University of Ottawa population.
So, for my dataset, this is how I would do a 2-sample t-test, 2-tailed:
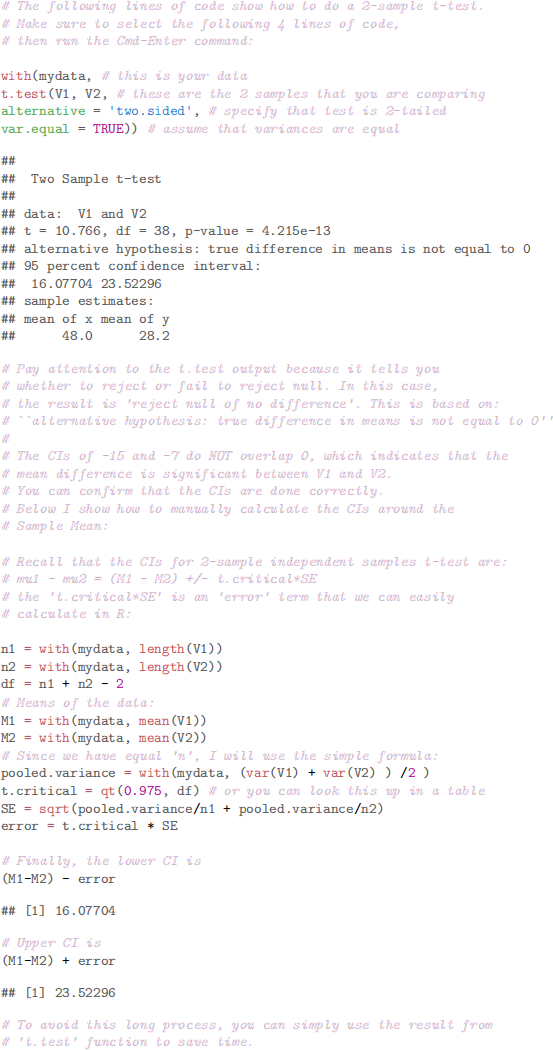
Let’s recap what happened. In the above R code, ‘mydata’ is your data from the .CSV file after you load it into R and save it into the variable ‘mydata’. The next lines of code tell R to conduct a t-test on 2 variables that are inside ‘mydata’, V1 and V2. A quick way to test what names your columns have is to run ‘names(mydata)’ in R. As a default, the t-test function calculates a 2-sided test, so you can remove this line (or keep it for completion). You have to tell the t-test function that the variances between your 2 data vectors are assumed to be equal. As we have done in class, you can run a confidence interval manually using a table in the book to look up tcritical. Alternatively, we can tell the t-test function to do this for us. You just have to supply the level of confidence that you want it to calculate.
For your report, I want you to report the tcritical. Instead of doing this the hard way, by getting a textbook with t-tables, we can do this easily and efficiently in R. However, it is useful to make sure your R value corresponds to the one in the t-tables from a textbook. For example, for an α = 0.05 and df = 10, the tcritical can be calculated with the following R code:
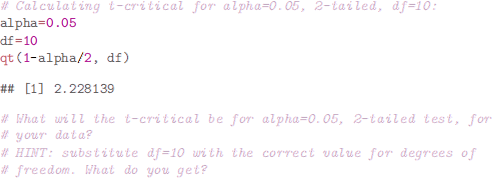
For my data set, using an α = 0.05, df = n1 +n2 −2 = 20 + 20−2 = 38, the tcritical = 2.024. Notice that the table in the book does NOT have df = 38, but tcritical for df = 40 is 2.021, which is very close to my tcritical with a slightly smaller df. Although it is standard procedure to use the smaller degrees of freedom and not the larger one (like here), for the sake of this assignment we’ll all choose the larger value. Using R, you are able to calculate the exact tcritical for any df, even the ones that do not show up in the textbook tables.
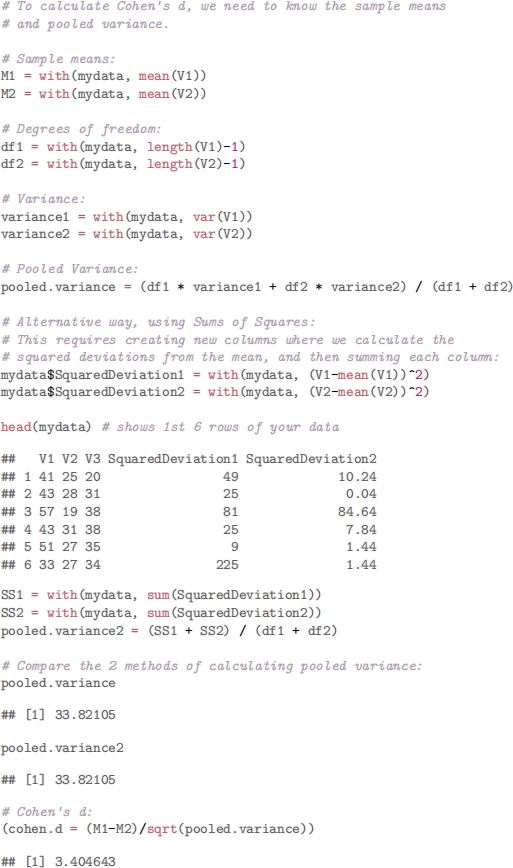
Next, we want to calculate Cohen’s d.
7.1 Summary/Conclusion
The final step of the process requires us to report our result in an APA format.
We found that the resting heart rate (RHR) of PSY2116 students (M = 48) was significantly different from that of the general population of University of Ottawa students (M = 28.2), t (38) = 10.77, p < 0.001, Cohen’s d = 3.4, 95% CI [16.08, 23.52]. In other words, we found evidence that Dr. Konar is causing PSY2116 students to have different heart rates than those found in the general population of the University of Ottawa students. In fact, he is causing students to have bradycardia, a lower heart rate of M = 48 compared to the general student population of M = 28.2.
We also found a large effect size which indicates that the class RHR is different enough from the general population of students at the University of Ottawa to indicate that taking PSY2116 with Dr. Konar is affecting the health of PSY2116 students.
2021-05-29