Economics 304WD Homework Lesson 4 Consumption & Saving
Hello, dear friend, you can consult us at any time if you have any questions, add WeChat: daixieit
Economics 304WD -- Homework - Lesson 4 – Consumption & Saving -- 110 points
You need to show your work, not just the final answer
Use the template to complete your work or points will be taken off.
Please put your name and PSU ID number at the top of the page
Save the file on your computer (.PDF is the only format allowed) and then upload it to the Canvas dropbox for this homework assignment.
Be sure your assignment is all on one file. Failure to submit a single file will result in points being deducted
This HW assignment is very relevant to the Great Recession experienced in the US from December 2007 - June 2009. In particular, we experience a significant and negative wealth shock and map out how this effects the consumption decisions of households. We let the Fed 'come to the rescue' and lower real rates of interest to extremely low (and negative) levels, much like they did during the Great Recession! It is here that we can really see how and why consumers react differently to a change in real interest rates based on whether they are a saver or a borrower. The intuition is hopefully clear: the saver, Dagwood in what follows, is worse off due to the fall in real rates and Homer, our borrower, is better off due to the lower real rates. This homework also addresses the net (aggregate) effect on consumption in an economy that consists of both savers and borrowers (like economies do), and also considers the outcome if the borrowers become credit constrained, like many are given that so many mortgages are under water, much in line from the excerpt below (Read the entire article). We conclude by considering the idea that the Fed may be making matters worse with their zero interest rate policy.
Edward Harrison at Credit Writedowns describes the Fed's zero interest rate policy as "toxic," noting that it is a transfer from savers and fixed-income investors to borrowers. On net, this is stimulative if the spending propensities of the latter exceeds that of the former, but the willingness of the borrowers to spend is constrained by weak household balance sheets. The Fed is thus pushing on a string, and possibly even making matters worse by reducing the income flow to households.

1. (30 points total – 5 points each part)
Suppose we have Dagwood, who has a current income of $200K and expected future income of $100K. He has $100K in current wealth but this is before he opens that #$@% envelope. He has zero expected future wealth.
Dagwood’s behavior is consistent with the life-cycle theory of consumption. For one, he perfectly smooths consumption and two, since he is in his peak earning years; he is saving now so that he can maintain his current level of consumption in the future.
Given that Dagwood faces a real interest rate of 0.05, answer the following questions.
a. Calculate Dagwood’s optimal consumption bundle showing all work. Note, for all C* calculations, round down to one decimal point.


c* = cf* =
b. Draw a completely labeled graph (the two-period consumption model) depicting this initial optimal consumption bundle and label it as point C*A. Be sure to label the no lending / no borrowing point = NL/NB.

c. Now Dagwood can’t help himself and opens up that envelope and “ouch” he says, his current wealth has lost eighty percent (80%) of its value and thus falls from $100K to $20K. Recalculate Dagwood’s ‘new’ optimal consumption point and label on your graph as point C*B.


c* = cf* =
d. Is Dagwood worse off or better off? Explain (hint, what has happened to his budget constraint (aka opportunity set)).
e. The Fed decides to conduct massive amounts of open market purchases and get the real rate of interest all the way down to - .05 (negative 5% = -.05). Recalculate the optimal bundle for Dagwood and add this point to your graph and label as point C*C. (Note, point C*C incorporates the shock to wealth in part c)


c* = cf* =
f. Is Dagwood better or worse off due to the fall in the real rate of interest? Explain being sure to discuss exactly how the substitution and income effects play a role here. Be sure to define what the income and substitution effects are and how they play a role in Dagwood’s decision to alter his previously optimal bundle (we are comparing part c to part e). Also, comment on whether these income and substitution effects work in the same or opposite direction (i.e., is it a tug of war or do they work in the same direction?) in this particular case.
2. (30 points total – 5 points each part)
Dagwood’s neighbor, Homer Simpson, does not abide by the life cycle theory of consumption. Homer has a “let’s live life like it’s our last day” mentality and thus, he prefers to consume more today, relative to the future. In particular, Homer prefers to consume exactly twice as much today, relative to consumption next period. Homer’s current income equals $150K and his future expected income = $150K. He has no wealth (neither current nor expected).
Homer faces a real interest rate of 0.05. Please answer the following questions.
a. Calculate Homer’s optimal consumption bundle showing all work.


c* = cf* =
b. Draw a completely labeled graph (the two-period consumption model) depicting this initial optimal consumption bundle and label it as point C*A. Be sure to label the no lending / no borrowing point = NL/NB.

Now Homer, of course, is not affected by the crashing market since he has no envelope to open!
c. Homer goes to work and the rumor being spread around the work place is that future demand is increasing as Homer works in the ‘green energy’ field. As a result, Homer revises his estimate of future income up to $200K (his current income is not effected). Recalculate the optimal bundle for Homer and add this point to your graph and label as point C*B.


c* = cf* =
d. Is Homer worse off or better off? Explain.
e. The Fed decides to conduct massive amounts of open market purchases and get the real rate of interest all the way down to -5% Recalculate the optimal bundle for Homer and add this point to your graph and label as point C*C. (Note, point C*C incorporates the shock to Homer’s future income in part c).


c* = cf* =
f. Is Homer better or worse off due to the fall in the real rate of interest? Explain being sure to discuss exactly how the substitution and income effects play a role in Homer's consumption decisions.
3. (30 points total – 5 points each part)
a. What is the net effect of this expansionary monetary policy (i.e., negative real rates of interest) on consumption, all else constant? To answer this question, assume we have an equal amount of "Dagwoods" and "Homers" so we can simply add the change in Dagwood's consumption to the change in Homer's consumption. Please give the actual change in consumption, given this expansionary policy.
Change in Dagwood’s consumption:
Change in Homer’s consumption:
Net change in consumption:
b. Now consider the case where Homer is credit constrained and thus, cannot qualify for cheap loans since his balance sheet is a wreck. As such, the real rate of interest that Homer faces is 10% (r = 0.10), and not the ultra-low negative real rate = -.05 that Dagwood (who has a solid balance sheet) faces. Please re-answer part a) above, assuming that Homer faces a real rate of 0.10 and Dagwood faces a real rate of (-.05). Use the actual numbers, that is, add the change in Dagwood's consumption (you already did this in 3a) to the change in Homer's consumption, given that he faces a real rate of 0.10, all else constant (i.e., after his yf rose).
Change in Dagwood’s consumption:
Change in Homer’s consumption:
Net change in consumption:
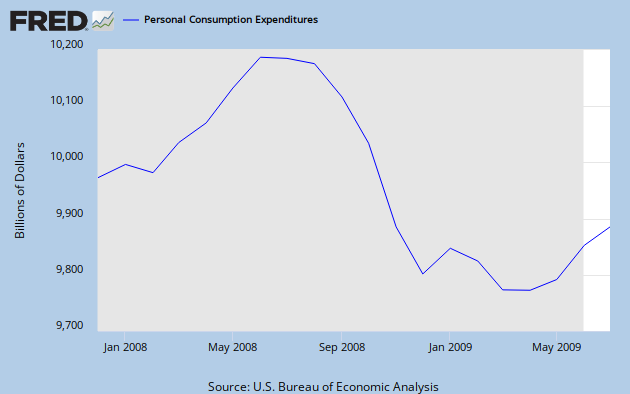
c. Are your results consistent with this graph of Personal Consumption Expenditures from FRED? Why or why not?
We are now going to derive and draw (depict) two desired savings functions for Homer and Dagwood respectively. Note importantly that savings in the present context is defined simply as y-c, that is, current income minus current consumption. Note also that savings can be positive or negative, it depends on whether you are a saver or borrower. In this assignment, Homer is the borrower so his savings is negative where Dagwood is the saver, and thus, his savings are positive. To derive a savings function we let real interest rates vary and map out the corresponding change in desired savings, all else constant.
d. Using the results from 1c and 1e, where a = $20K, derive the desired savings function (for Dagwood) labeling the point from 1c as point A and the results from 1e as point B. Connect the points and we have the savings function for Dagwood. Make sure you put in parentheses next to the savings function what we are holding constant and show your work.
![]()
We now move on to the results for Homer. We are going to do the exact same exercise that we did for Dagwood.
e. Using only the results from 2c and 2e, where yf = $200K, derive the desired savings function (for Homer) labeling the point from 2c as point A and the point from 2e as point B. Connect the points and we have the savings function for Homer. Make sure you put in parentheses next to the savings function what we are holding constant.
f. Suppose you were Janet Yellen’s cousin and was head of the central bank in an economy filled with Dagwoods (savers). Suppose also that your economy was in a recession and you wanted to stimulate consumption today as part of your dual mandate. Suppose the current real rate of interest is zero. Would you raise or lower real interest rates to stimulate consumption? Explain in detail using the substitution and income effects.
(20 points total )
4. Below is the foundation of the two-period consumption model discussed in class. You are given the no lending – no borrowing point (NL/NB) for this economic agent.

a) [2.5]Clearly label both the vertical and the horizontal axis in this model.
b) [2.5]Assume the Fed sets the real interest rate at rFED. Draw a budget constraint assuming that this consumer can borrow and save at rFED. Label this BCFED.
In the ‘real world’ the rate at which you can borrow and the rate at which you can save are different than the Federal Funds rate set by the FOMC. For instance, the rate at which someone can save is traditionally less than the Federal Funds rate and the rate at which someone can borrow is traditionally higher than the Federal Funds rate.
c) [2.5]Why, in the real world, do we traditionally see the rate at which an individual can save is different than the rate at which an individual can borrow?
Let rB represent the rate at which a consumer can borrow, which is greater than rFED and let rS represent the rate at which a consumer can save, which is less than rFED.
d) [5]Draw me a budget constraint assuming that rB is the rate at which this economic agent can borrow and rS is the rate at which this economic agent can save. Label this BCREAL.
e) [2.5]In the ‘real-world’ situation, are borrowers better or worse off? Explain.
f) [2.5]In the ‘real-world’ situation, are savers better or worse off? Explain.
g) [2.5]There is one type of economic agent that does not get influenced by a change in the real interest rate. What characteristics does this type of economic agent have?
2023-02-06