BUSN 5502 Fundamentals of Business Analytics
BUSN 5502 Fundamentals of Business Analytics
Final Exam Preliminaries - Fundamentals of Business Analytics - ECON5002, Semester I 2021
The final exam will be online on May 29th, starting 14:00 and finishing at 16:00 (2 hours including reading time).
The final exam has two computer questions. You will need to submit electronically via LMS on the day of the exam
1. The final exam labeled <name initials>_FE.pdf by 16:05 pm.
2. Two R-code scripts - label the files as <name initials>_q<question number>.r by 16:40 pm.
I should be able to run your script file and reproduce the results that you will report in the exam.
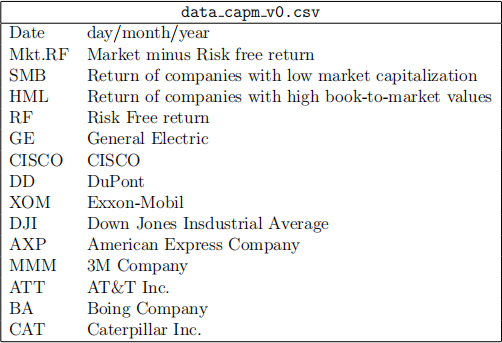
1. The data capm v0.csv have observations from daily rates of return comprising the period of January 2007 to December 2013. The variables are described below:
Let us explore again the CAPM model. The regression models to be investigated include
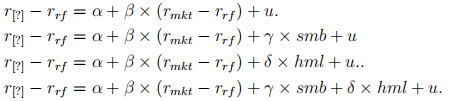
where  is the return of one asset to be informed on the exam paper,
  is the risk free return,
  is the market return, and smb and hml correspond to SMB and HTM defined in the above Table. The variable u is the error term. You should be able to:
1. (a) Obtain a summary statistics of each of the return series.
(b) Produce a scatter plot with
on the y-axis and
on the x-axis, and include the regression line in it.
(c) Estimate
and their respective standard errors. Verify if the es-timated coefficients are statistically significant. Interpret the coefficients of the regressions.
(d) Estimate confidence intervals for
possibly assuming heteroskedas-ticity of the variance of the residuals.
(e) Perform hypothesis testing on the parameters of the model (single or joint rescric-tions) possibly assuming heteroskedasticity of the variance of the errors.
(f) Test if the errors are heteroskedastic (Breustch-Pagan test), and interpret the result.
(g) Perform model comparision tests, considering that one or more models are nested into a large model (waldtest).
2. We now study the behavior of the inflation of finished goods derived from inflation_finished_goods.csv data, which is quarterly data from 1960:2 to 2008:2 of the USA economy (193 observations). Let us call this series yt which can follow an ARMA(p,q) process

The lags of the autoregressive and moving average components will be informed on the exam. You should be able to:
(a) Plot the series across time.
(b) Plot the autocorrelation and partial autocorrelation functions, and use this infor-mation to determine the order of the ARMA.
(c) Estimate
, and their respective standard errors. Verify if the estimated coefficients are statistically significant.
(d) Perform diagnostic tests (Ljung-Box).
(e) Perform model comparision (AIC and BIC).
2021-05-24