Assignment 2-Part B
Hello, dear friend, you can consult us at any time if you have any questions, add WeChat: daixieit
Assignment 2-Part B (1003)
1. THE BANK CUSTOMER WAITING TIME CASE The mean and the standard deviation of the sample of 100 bank customer waiting times are x =5.46 and
s=2.475.
a) Use the Empirical Rule to calculate estimates of tolerance intervals containing
68.26 percent, 95.44 percent and 99.73 percent of all possible bank customer waiting times.
b) Does the estimate of a tolerance interval containing 68.26 percent of all waiting times provide evidence that at least two-thirds of all customers will have to wait less than eight minutes for service? Explain your answer.
2. In order to control costs, a company wishes to study the amount of money its sales force spends entertaining clients. The following is a random sample of six entertaining expenses (dinner costs for four people) from expense reports submitted by members of the sales force $157 $132 $109 $145 $125 $139

a) Calculate x , s 2 , and s for the expense data, use the two different formulas to calculate s 2 .
3. Thirteen internists in the Midwest are randomly selected, and each internist is asked to report last year’s income. The incomes obtained (in thousands of dollars) are 152, 144, 162,154, 146, 241, 127, 141, 171, 177, 138, 132, 192. Find:
1. The 90th percentile.
2. The median.
3. The first quartile.
4. The third quartile
5. The 10th percentile.
6. The inter-quartile range.
7. Develop a box-and-whiskers display.
4. The following data show the method of payment by 18 customers in a supermarket checkout line. Here, C refers to cash, CK to check, CC to credit card, and D to debit card, and O stands for other.

1. Construct a frequency distribution table.
2. Calculate the relative frequencies and percentages for all categories.
3. Draw a pie chart for the percentage distribution.
5. The following table gives the frequency distribution of the gallons of gasoline purchased by all customers on one day at a certain gas station.
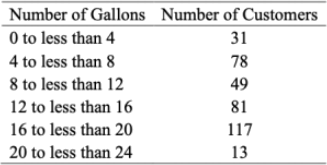
1. Prepare a cumulative frequency distribution.
2. Calculate the cumulative relative frequency and cumulative percentage for each class.
3. Find the percentage of customers who purchased less than 16 gallons.
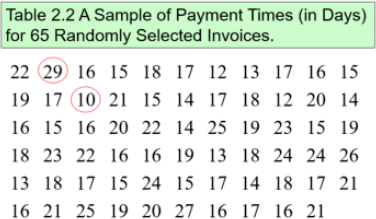
6. Construct a Stem-and-Leaf Display and comment based on the display.
a) Draw a Stem-and-Leaf Display by hand.
b) Use SPSS to construct a Stem-and-Leaf display to see if it is same the result in a).
2023-02-02