QBUS2820 Predictive Analytics
QBUS2820 Predictive Analytics
Semester 1, 2021
Individual Assignment 2
Key information
1. Required submissions:
a. ONE written report including Task A and Task B (word or pdf format, through Canvas- Assignments- Report Submission (Individual Assignment 2)).
b. ONE Jupyter Notebook .ipynb file (through Canvas- Assignments- Upload Your Program Code Files (Individual Assignment 2)).
2. Due date/time: Sunday 6-Jun-2021, 11:59 pm.
3. The late penalty for the assignment is 5% of the assigned mark per day, starting after the due date. The closing date Wednesday 16-Jun-2021, 11:59 pm is the last date on which an assessment will be accepted for marking.
4. Weight: 30% of the final mark.
5. Anonymous marking: Owing to the anonymous marking policy of the University, please only include your student ID in the submitted report, and do NOT include your name. The file name of your report and code file should follow the following format. Replace "SID" with your Student ID. Example: SIDAssignment2S22021.
6. Presentation of the assignment is part of marking criteria of the assignment. Markers will assign 5 marks for clarity of writing and presentation. Numbers with decimals should be reported to the four-decimal point.
Key rules:
■ Carefully read the requirements for each part of the assignment.
■ Please follow any further instructions announced on Canvas.
■ Reproducibility is fundamental in data analysis, so that you will be required to submit a Jupyter Notebook that generates your results. Not submitting your code will lead to a loss of 50% of the assignment marks.
■ Failure to read information and follow instructions may lead to a loss of marks. Furthermore, note that it is your responsibility to be informed of the University of Sydney and Business School rules and guidelines, and follow them.
■ Referencing: Harvard Referencing System. (You may find the details at: http://libguides.library.usyd.edu.au/c.php?g=508212&p=3476130)
Task A
Question 1
We are using K-nearest neighbours (KNN) regression to resolve the following tasks. The data set is given in the following table with 2 features X1 and X2:
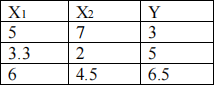
Suppose we have a new test data point  .
.
a. With k = 1 in KNN regression, find
.
b. With k = 2 in KNN regression, find
c. With k = 3 in KNN regression, find
Question 2
a. What is overfitting?
b. How do we cope with overfitting?
c. We have seen methods like Ridge and LASSO to reduce variance among the coefficients. We can use these methods to do feature selection also. Which one of them is more appropriate? Explain.
Question 3
Travellers frequently buy insurance, which pays for medical emergencies while travelling. The premiums are determined primarily on the basis of age. However, additional variables are often considered. Foremost among these are continuing medical problems such as cancer and previous heart attacks. The help refine the calculation of premiums, on actuary was in the process of determining the probabilities of various outcomes. One area of interest is people who have diabetes. It is known that diabetics suffer a greater incidence of heart attacks than non diabetics. After consulting medical specialists, the actuary found that diabetics who smoke, have high cholesterol levels and are overweight have a much higher probability of heart attacks. Additionally, age and gender also affect the probability in virtually all populations. To evaluate the risks more precisely, the actuary took a random sample of diabetics and used the following regression model:
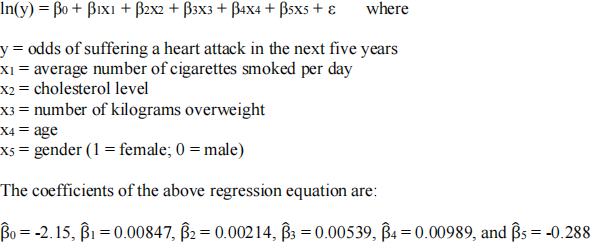
a. What is the above model called?
b. Is ordinary least squares (OLS) regression model appropriate in this scenario? Why or why not?
c. Was this model estimated by the method of least squares? If not, what estimation method was used?
d. Interpret the sign of each of the coefficients (except the intercept) in terms of the probability that an individual will probably have a heart attack in the next five years.
e. Calculate the probability of a heart attack in the next five years for the following individual who suffers from diabetes:
Average number of cigarettes per day: 20
Cholesterol level: 200
Number of kilograms overweight: 25
Age: 50
Gender: Male
f. Refer to part (d). How would you classify this particular individual?
g. Recalculate the probability of a heart attack if the individual in part (d) is able to quit smoking.
h. Recalculate the probability of a heart attack if the individual in part (d) is able to reduce their cholesterol level to 150.
i. Recalculate the probability of a heart attack if the individual in part (d) loses 25 kilograms.
Question 4
Suppose that X1, . . . , Xn form a random sample from a normal distribution for which both the mean and the variance are unknown.
a. Find the maximum likelihood estimators (MLEs) of μ and
.
b. Refer to part (a). Are they unbiased for μ and
c. Find the MLE of the 0.95 quantile of the distribution; i.e., of the point θ such that P(X < θ) = 0.95.
d. Find the MLE of φ = P(X > 2).
Question 5
Consider the MA(2) model:


Calculate
a. E
for i = 1, 2, 3, 4 where
is all information up to and including time t.
b. Var
c. Derive an expression for a 2-standard error confidence band around the forecast of
for i = 1, 2, 3, 4; i.e.,
. Your answer to part (a) gives the forecast, and your answer to part (b) gives you the standard error of your forecast.
Task B
In this task, you will use “Visitors.csv” data to forecast 24 months of monthly number of visitors to a country following the last period in the dataset.
Your objective isto develop univariate forecastingmodels, i.e., only using the historical number of visitors, to address this problem.
You can download the dataset “Visitors.csv” from Canvas.
In this task, you need to:
■ conduct exploratorydataanalysis
■ select 2 different forecastingmodels with justifications to complete the forecasting task. At least one of the two forecasting models must be the models covered in the unit. For the presented two models, you need to present:
● your rationale,
● methodology,
● model diagnostics,
● model validations,
● forecasting results for 24 months of monthly number of visitors following the last period in thedataset.
■ present conclusions, limitations and next step suggestions.
2021-05-21