COMP5349: Cloud Computing
COMP5349: Cloud Computing Sem. 1/2021
Assignment 2: Spark Data Analytics
Individual Work: 20% 10.05.2021
1 Introduction
This assignment tests your ability to use various Spark APIs to implement given workloads. It also test your ability to analyze and tune the performance of Spark application.
The assignment data set contains tweet objects downloaded from Twitter using Tweeter standard search API. The downloaded tweet objects are stored in a single JSON file. A tweet object may refer to a general tweet, a retweet or a reply to a tweet. A general tweet is “a message posted to Twitter containing text, photos, a GIF, and/or video”1. A reply is a response to another person’s tweet2 . “A Retweet is a re-posting of a Tweet.”3 Below is an example of a retweet object:
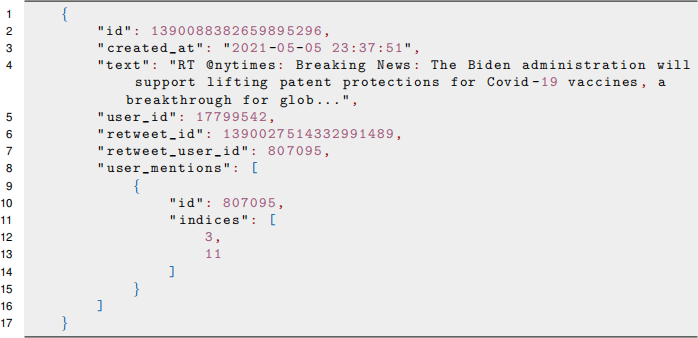
The common fields in all tweet objects are:
• id: the unique id of the tweet.
• created_at: the date and time the tweet is created.
• text: the textual content of the tweet
• user_id: the id of the user who created the tweet.
• retweet_count: retweet count of the tweet or its parent tweet if the tweet is a retweet
• favorite_count: favorite count of the tweet
The optional fields are:
• retweet_id: included only in retweet object. It contains the id of the tweet it re-posts.
• retweet_user_id: included only in retweet object. It contains the user_id of the tweet it re-posts.
• replyto_id: included only in reply object. It contains the id of the tweet it responds to.
• replyto_userid: included only in reply object. It contains the user id of the tweet it responds to
• user mentions: included only if the tweet text mentions one or more users. It is an array of {id, indices} showing the id of the users mentioned in the tweet text, as well as the location this user is mentioned.
• hash tags: included only if the tweet text contains one or more hash tags. It is an array of {tag, indices} showing the hash tag appearing in the tweet text and the location it appears
The data set is provided as a multi line JSON file and should be loaded into Spark data frame using the following statement:
spark . read . option ( ” multiline ” , ” true ” ) . json ( file_path )
Missing fields in an object will have null value in the data frame.
2 Workload One
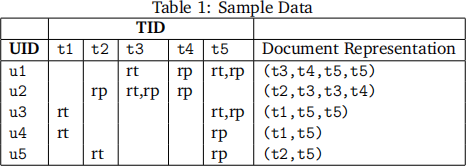
In this workload, you are asked to find the top 5 users with similar interest as a given user id. We measure a user’s interest based on the tweets they have replied or retweeted. We can represent each user as a tokenized document, with all tokens as ids of the tweets the user has replied or retweeted. Assume we have a sample data set with five tweets: t1,t2,t3,t4, t5 and five users: u1,u2,u3,u4, u5, table 1 shows the reply/retweet relation from user to tweet. The last column shows the corresponding document representation of each user. For instance, u1 has retweeted t3, t5 and replied t4,t5, the document repre-sentation is (t3,t4,t5,t5).
To implement the workload, you need to to transform each user document represen-tation into a vector and use Cosine similarity to compute the similarity between two user vectors. SparkML provides a number of feature extractors such as TF-IDF, Word2Vec and more. You are asked to experiment with two feature extractors and compare the execution performance in local and EMR cluster (minimum 3 nodes) setting. You can use any user id in the data set as the given user id. For each feature extractor, you can set your own parameter values. There is no standard result to the workload.
3 Workload Two: User Recommendation
We consider two groups of users. One group contains users that appear in the user id field of a tweet object, we call them tweet users; another group contains users mentioned in a tweet, we call them mention users. In this workload, you are asked to use collaborative filtering algorithm in SparkML library to recommend top 5 mention users to each tweet user in the data set.
Collaborative filtering aims to fill in the missing entries of a user-item association ma-trix. We treat tweet users as ‘user’ and mention users as ‘item’ in this setting. The rating is computed as number of times a tweet user mentions a mention user. You are asked to prepare the raw data in the format as required by the collaborative filter algorithm and build a model to perform the recommendation. Similar to workload one, you are asked to run the workload in local and EMR cluster setting and observe the performance statistics.
4 Coding and Execution Requirement
Below are requirements on coding and Execution:
• You should implement both workloads in PySpark. You can use SparkRDD, SparkSQL and SparkML API.
• There should be a single driver program for both workloads. You should provide python script version of the implementation as well as Spark submit script. There should be enough comment to help understand the data flow of each workload. You may also submit a notebook version.
• You should not modify the input data file in any way and your code should read the data file from the same directory as the source code.
5 Deliverable
There are two deliverables: source code and project report. Both are due on Wednesday 26th of May 23:59 (Week 12). There will be separate submission links for source code and project report on Canvas. The report needs to be submitted as a pdf file. The source code could be submitted as a zip file containing python script(s) and spark submission script(s) and/or Jupyter notebook file. The source code could be submitted as a zip file containing Python script(s), Spark submission script(s) and, optionally, Jupyter Notebook files. In other words, the submission of Python script(s) and Spark submission script(s) are compulsory, while Jupyter notebook file is optional. Please do not include data file in the zip file. There will be penalty point for including data file.
There will be a 10 minutes demo in week 12, 13, or STUVAC. You need to attend the demo to receive mark for this assignment!
6 Report Structure
The report should contain four sections:
• A brief introduction
• Workload one
– design
– performance analysis
• Workload two
– design
– performance analysis
• A brief conclusion
The design section should describe overall data flow of each workload. You can include DAG chart to visualize the sequence of operations. You may include short code snippets in this section to help explain certain points. You should highlight performance optimization features you use in the implementation; this could include choosing certain operations to minimize shuffling, using RDD persistence or other features.
The Performance Analysis section should give an overview of the execution environ-ment as well as the execution configuration (executor capacity, number of executors, etc) you have chosen. It should include a few graphs and/or tables highlighting performance variations under various settings. You can include screenshots of history server pages. You should also include enough explanation of the performance statistics and differences observed.
7 Mark Distribution
• Implementation/Source code: 14 points
– 7 points for each workload
– Your code should be executable and follow the coding requirement to receive points for coding section.
• Report: 6 points
– The report (including all headings, labels and legends in figures and graphs, and captions) must be written in Academic English. All sources that you have used must be properly cited and referenced.
– Your report must be submitted in the submission links for report. Otherwise, you may lose mark for that.
– Your code should be executable and follow the coding requirement to receive points for report section.
2021-05-21