ALY 6015 Intermediate Analytics Module 5 Assignment
ALY 6015 Intermediate Analytics Module 5 Assignment
Class ALY6015 – Intermediate Analytics
Module 5 Assignment: Nonparametric Methods and Sampling
Overview and Rationale
In this assignment, you will use your knowledge of nonparametric statistical methods and sampling to solve various types of problems.
Course Outcomes
This assignment is directly linked to the following key learning outcomes from the course syllabus:
● State the advantages and disadvantages of nonparametric methods.
● Test hypotheses, using the following methods: sign test, Wilcoxon rank sum test, signed-rank test, Kruskal-Wallis test, and the runs test.
● Compute the Spearman rank correlation coefficient.
● Demonstrate a knowledge of the four basic sampling methods.
● Recognize faulty questions on a survey and other factors that can bias responses.
● Solve problems, using simulation techniques.
Submission Requirements
1. Complete paperwork in MS Word format (.docx) must include:
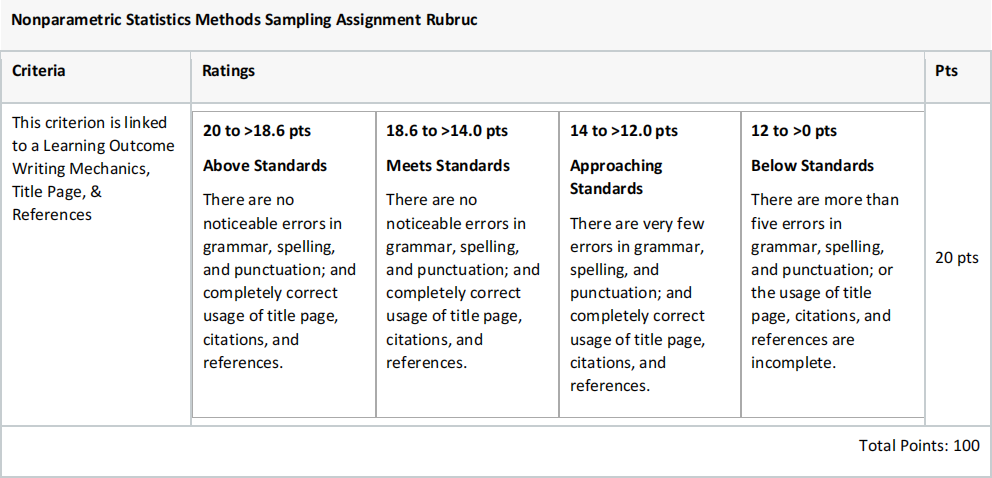
● Title Page
o Your name (as registered in Canvas)
o Assignment name
o Class number, name and CRN Number
o Your contact information (NEU email)
● Assignment summary section.(Explain assignment summary, plans, goals, dataset).
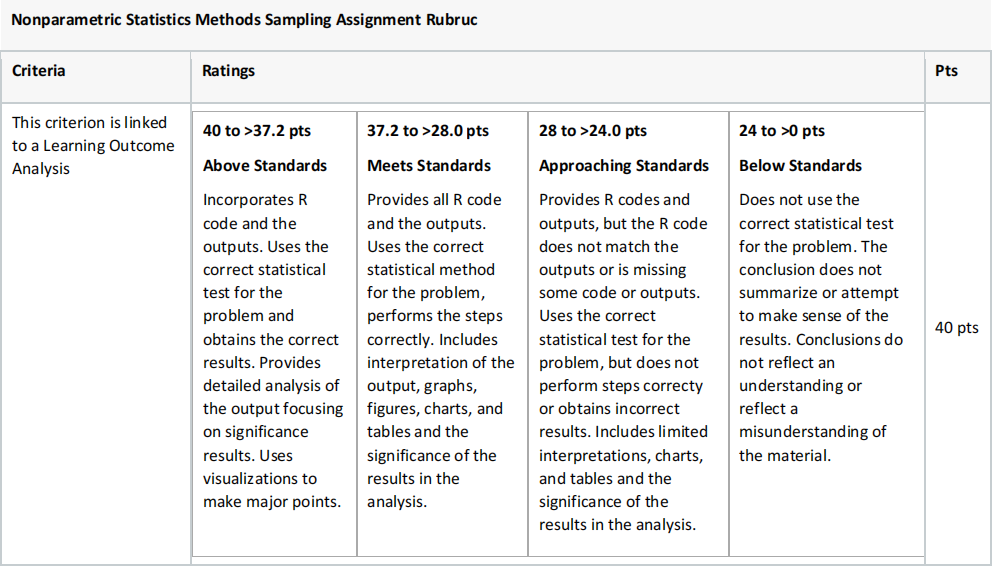
● Each step of the research with supporting screenshots, charts, results generated by R code.
● Explain each screen shot from the data standpoint.
● Each output generated by R code must be present and explained in the paperwork.
● Each output, chart, table, screenshot shown in the paperwork must have corresponding R code that generates it.
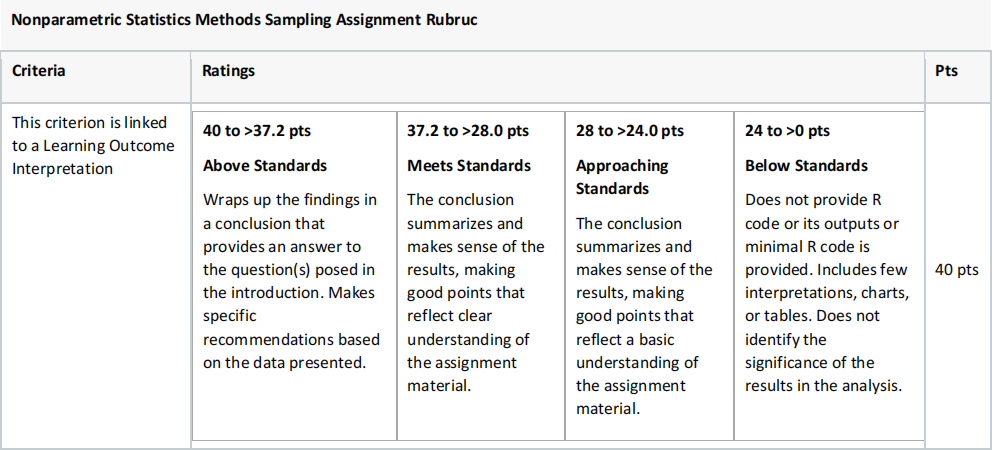
● Final conclusions section. (Explain if goals were achieved as expected or not, summary of you findings about analyzed data).
● References (optional)
2. Complete R code file meet the following criteria:
● Submitted in R script (.r file format). Only .r file format will be accepted.
● Each line of code must be commented. (Explain why do you execute this line of code, not what the command does).
● Code must be runnable on any computer. Any errors in executing R code will results in significant points deduction. (Follow the guidelines provided in the class and user R code examples provided in Canvas)
3. Submit dataset(s) used in the research.
Assignment summary
Follow the instructions section and complete each task utilizing the nonparametric statistical methods and techniques.
Instructions
Perform these steps:
1. State the hypotheses and identify the claim.
2. Find the critical value(s)
3. Compute the test value.
4. Make the decision.
5. Summarize the results.
Use the traditional method of hypothesis testing unless otherwise specified. Assume all assumptions are met.
Task 1: Game Attendance
An athletic director suggests the median number for the paid attendance at 20 local football games is 3000. The data for a random sample are shown. At α = 0.05, is there enough evidence to reject the claim? If you were printing the programs for the games, would you use this figure as a guide?
|
6210
|
3150 |
2700
|
3012 |
4875
|
|
3540
|
6127
|
2581
|
2642
|
2573
|
|
2792
|
2800
|
2500
|
3700
|
6030
|
|
5437
|
2758
|
3490
|
2851
|
2720
|
Source: Pittsburgh Post Gazette
Task 2: Lottery Ticket Sales
A lottery outlet owner hypothesizes that she sells 200 lottery tickets a day. She randomly sampled 40 days and found that on 15 days she sold fewer than 200 tickets. At α = 0.05, is there sufficient evidence to conclude that the median is below 200 tickets?
Use the Wilcoxon rank sum test. Assume that the samples are independent. Also perform each of these steps.
1. State the hypotheses and identify the claim.
2. Find the critical value.
3. Compute the test value.
4. Make the decision.
5. Summarize the results.
Use the traditional method of hypothesis testing unless otherwise specified. Assume all assumptions are valid.
Task 3: Lengths of Prison Sentences
A random sample of men and women in prison was asked to give the length of sentence each received for a certain type of crime. At α = 0.05, test the claim that there is no difference in the sentence received by each gender. The data (in months) are shown here.
|
Males
|
8 | 12 | 6 | 14 | 22 | 27 | 32 | 24 | 26 | 19 | 15 | 13 |
|
|
|
Females
|
7 | 5 | 2 | 3 | 21 | 26 | 30 | 9 | 4 | 17 | 23 | 12 | 11 | 16 |
Source: Based on information from the National Highway Traffic Safety Administration.
Task 4: Winning Baseball Games
For the years 1970–1993 the National League (NL) and the American League (AL) (major league baseball) were each divided into two divisions: East and West. Below are random samples of the number of games won by each league’s Eastern Division. At α = 0.05, is there sufficient evidence to conclude a difference in the number of wins?
|
NL
|
89 | 96 | 88 | 101 | 90 | 91 | 92 | 96 | 108 | 100 | 95 |
|
|
AL
|
108 | 86 | 91 | 97 | 100 | 102 | 95 | 104 | 95 | 89 | 88 | 101 |
Task 5: Wilcoxon Signed-Rank Test.
Use Critical Values for the Wilcoxon Signed Rank Test Table (Table K). Determine whether the null hypothesis should be rejected for the following:
1.
= 13, n = 15, α = 0.01, two-tailed
2.
3.
4.
Use the Kruskal-Wallis test and perform these steps.
1. State the hypotheses
2. Find the critical value.
3. Compute the test value.
4. Make the decision.
5. Summarize the results.
Task 6: Mathematics Literacy Scores
Through the Organization for Economic Cooperation and Development (OECD), 15-year-olds are tested in member countries in mathematics, reading, and science literacy. Listed are randomly selected total mathematics literacy scores (i.e., both genders) for selected countries in different parts of the world. Test, using the Kruskal-Wallis test, to see if there is a difference in means at α = 0.05.
|
Western Hemisphere
|
Europe
|
Eastern Asia
|
|
527
|
520
|
523
|
|
406
|
510
|
547
|
|
474
|
513
|
547
|
|
381
|
548
|
391
|
|
411
|
496
|
549
|
Source: National Center for Education Statistics
Perform these steps.
1. Find the Spearman rank correlation coefficient.
2. State the hypotheses.
3. Find the critical value. Use α = 0.05.
4. Make the decision.
5. Summarize the results.
Task 7: Subway and Commuter Rail Passengers
Six cities are randomly selected, and the number of daily passenger trips (in thousands) for subways and commuter rail service is obtained. At α = 0.05, is there a relationship between the variables? Suggest one reason why the transportation authority might use the results of this study.
|
City
|
1 | 2 | 3 | 4 | 5 | 6 |
|
Subway
|
845
|
494
|
425
|
313
|
108
|
41
|
|
Rail
|
39
|
291
|
142
|
103
|
33
|
38
|
Source: American Public Transportation Association.
Use random numbers to simulate the experiments. The number in parentheses is the number of times the experiment should be repeated.
Task 8: Prizes in Caramel Corn Boxes
A caramel corn company gives four different prizes, one in each box. They are placed in the boxes at random. Find the average number of boxes a person needs to buy to get all four prizes. (40)
Task 9: Lottery Winner
To win a certain lotto, a person must spell the word big. Sixty percent of the tickets contain the letter b, 30% contain the letter i, and 10% contain the letter g. Find the average number of tickets a person must buy to win the prize. (30)
2021-05-19