Part I: Report based on Simulation Study
Part I: Report based on Simulation Study
You will be required to write code in order to investigate the behaviour of two different active control systems. You can write the code in Python, Matlab or whatever you prefer – please submit the code as an appendix to your assignment (this does not count towards the page limit). You will be awarded marks for performing the calculations described in the questions below using the appropriate equations and methods, which you should describe in your report. You will also be awarded marks for appropriate presentation of your results (e.g. figures with correctly labelled axes etc.) and for the written analysis and discussion motivated by the questions below. You will also be awarded marks for exploration and discussion that goes beyond the specific questions below. You should structure the report as a self-contained document.
Q1.
A vibrating plate can be controlled using a feedback control system. This question focuses on the behaviour of a single-input single-output (SISO) feedback controller. You are provided with the plant response of the system, G(jw), over frequency; this describes the response between a single control actuator and a single error sensor located on a flat plate; the error sensor in this case senses the velocity of the structure. The required data can be downloaded from the course blackboard site ‘Feedback_Control_Q1’.
a) Draw a block diagram for the SISO feedback controller, showing how the plant response interacts with the controller and the disturbance signal. Be sure to label all of the signals and describe the diagram in your own words in the text.
b) Through plotting the Nyquist and Bode plots for the given plant response, determine the frequency independent feedback gain required to give a gain margin of 6 dB. Discuss the assumptions on which the Nyquist stability criterion are based and how the gain margin can ensure that a feedback controller remains stable in the case of uncertainties in the plant response, G(jw), (you can relate this to the robust stability of a feedback controller).
c) Calculate and plot the sensitivity function for different levels of feedback gain that maintain a stable closed-loop system. In relation to this plot, comment on the trade-off between attenuation and enhancements in the disturbance signal. Explain how you have ensured that the closed-loop system is stable and comment on how the stability margin changes when you change the gain.
d) The control system considered in this question uses a velocity feedback control strategy. With example to practical applications, explain under what circumstances you might use a feedback controller compared to a feedforward controller.
Q2.
A small aircraft is equipped with 4 loudspeakers and 16 error microphones for the purpose of noise control. The transfer response between each loudspeaker and microphone, G, is provided together with the disturbance signal, d, at each error sensor for a single frequency. The required data can be downloaded from the course blackboard site ‘Feedforward_Control_Q2’.
i) G the 16*4 matrix of complex plant responses at a single frequency
ii) d the 16*1 vector of complex disturbance signals at the error sensors for this frequency
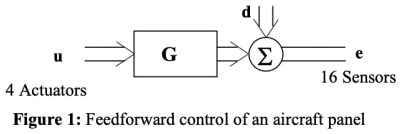
a) Calculate the vector of control signals required to minimise the sum of mean-square error signals and hence calculate the maximum attenuation that can be achieved in the sum of the mean-square error signals, in dB. Comment on the relative magnitudes and phases of the four control loudspeakers.
b) Plot the eigenvalues of the matrix  and comment on their relevance to the behaviour of a feedforward active control system.
c) Write a computer program that implements the single frequency, tonal steepest-descent algorithm in this multichannel case and plot the convergence behaviour of the sum of the mean-square error signals over time for various values of the convergence coefficient. What is the maximum stable convergence coefficient according to your simulation results and how does this compare to the theoretical maximum? Why might there be differences between the theoretical maximum and maximum calculated you’re your simulations?
d) Plot the behaviour of the control effort,  , over time for a convergence coefficient that is about half of the theoretical maximum. In practice it is often necessary to trade- off between the level of reduction in the sum of the mean-square error signals and the required control effort, this can be achieved by using the modified cost function
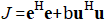
where b is a regularisation or leakage factor. For this cost function, derive the expression for the optimal vector of control sources and plot the control effort against the attenuation in the sum of the mean-square error signals for different values of b. Discuss why you may wish to limit the control effort in practical
2021-05-11
You will be required to write code in order to investigate the behaviour of two different active control systems.