STAT4602 MULTIVARIATE DATA ANALYSIS
DEPARTMENT OF STATISTICS AND ACTUARIAL SCIENCE
TEST
STAT4602 MULTIVARIATE DATA ANALYSIS
April 16, 2021 Time: 12:30 p.m. − 2:20 p.m.
Answer ALL TWO questions. Marks are shown in square brackets.
Answers must be handwritten
1. In a study of the cost of transporting milk from farms to dairy plants, survey was taken of firms engaged in milk transportation. Cost data on X1 = fuel, X2 = repair, X3 = capital, all measured on a per-mile basis, are recorded for n1 = 36 gasoline trucks and n2 = 23 diesel trucks. The sample mean and sample covariance for each of the two groups of trucks are given below and stored in MILK.TXT.
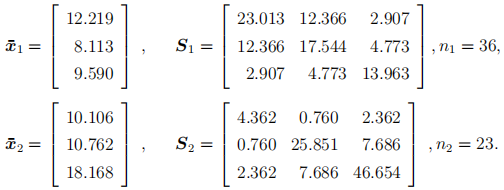
(a) Assume that the population covariance matrices for gasoline trucks and diesel trucks data are equal, use the Hotelling’s T2 statistic to test for the equality of the mean cost vectors at the 1% level of significance.
(b) Construct a likelihood ratio test (of first principle) and the Box modified likelihood ratio test to test for the equality of population covariance matrices of the two groups of truck at the 1% level of significance. (You are required to report the values of the test statistics, critical values and p-values).
(c) Suppose that the population covariance matrices are not equal, test for the equality of the mean cost vectors at the 1% level of significance.
(d) Let µi = E(Xi), i = 1, 2, 3, for group 2 (diesel trucks). Test H0 : µ1 = µ2 = 0.5µ3 at the 1% level of significance.
[Total: 50 marks]
2. In the SAS data set FITNESS.SAS, there are 6 variables as follows:
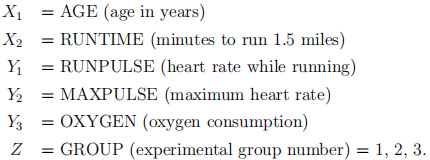
X1 and X2 are explanatory variables, and Y1, Y2 and Y3 are response variables.
(a) Perform a multivariate regression of Y1, Y2 and Y3 on X1 and X2, ignoring Z, and report the regression equations with standard errors of coefficient estimates.
(b) Perform a multivariate regression, taking into account the group membership (by means of constructed dummy variables) which allows different regression parameter estimates for different groups.
(i) Give the least squares regression equation of Y1 on X1, X2 and the dummy variables. Do the same for Y2 and Y3, respectively. Hence report the separate estimated multivariate regression equations for the 3 groups; show your steps.
(ii) Test the null hypothesis that the multivariate regression equations have the same regression parameter values (excluding the intercepts) across the 3 different groups. Given the value of the Wilks’ Lambda test statistic, its p-value and the conclusion at the 5% level of significance.
(iii) Based on the analysis in (ii), which model would you choose? Write down the model, with parameter estimates, that you have chosen.
[Total: 50 marks]
********** END OF PAPER **********
2021-05-10