ALY 6015 Intermediate Analytics Module 3 Assignment
ALY 6015 Intermediate Analytics Module 3 Assignment
Class ALY6015 – Intermediate Analytics
Module 3 Assignment: GLM and Logistic Regression
Overview and Rationale
In order to consolidate your theoretical knowledge into technique and skills with practical and applicational value, you will use the glm() function in R to fit a Logistic Regression model to perform classification.
Course Outcomes
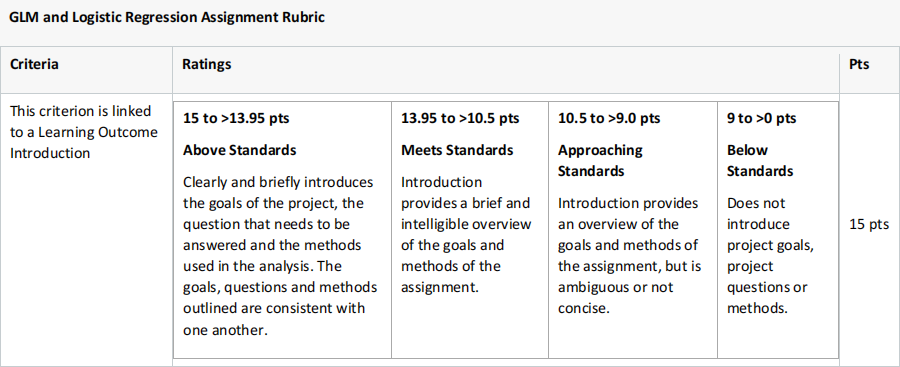
This assignment is directly linked to the following key learning outcomes from the course syllabus:
● Use “R” effectively to process, analyze and depict data
● Develop more advanced models to interpret data
● Use advanced generalized linear methods to answer strategic and operational questions
● Prepare complex dataset for analysis
● Use multivariable and logistic regression method to improve predictive outcomes
Submission Requirements
1. Complete paperwork in MS Word format (.docx) must include:
● Title Page
o Your name (as registered in Canvas)
o Assignment name
o Class number, name and CRN Number
o Your contact information (NEU email)
● Assignment summary section.(Explain assignment summary, plans, goals, dataset).
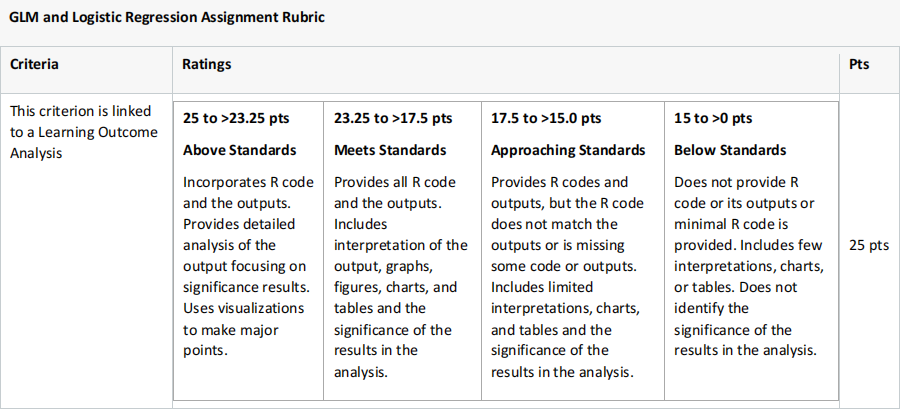
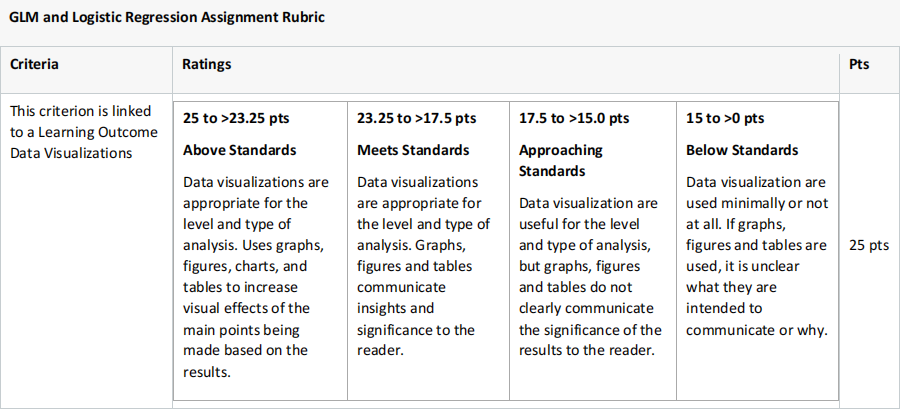
● Each step of the research with supporting screenshots, charts, results generated by R code.
● Explain each screen shot from the data standpoint.
● Each output generated by R code must be present and explained in the paperwork.
● Each output, chart, table, screenshot shown in the paperwork must have corresponding R code that generates it.
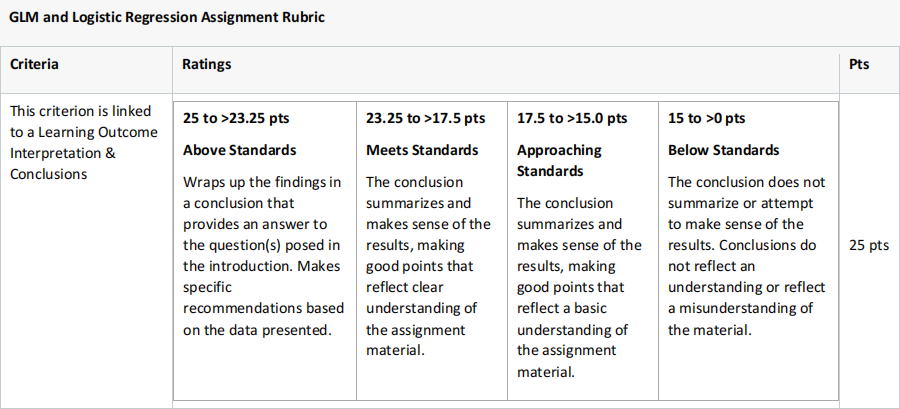
● Final conclusions section. (Explain if goals were achieved as expected or not, summary of you findings about analyzed data).
● References (optional)
2. Complete R code file meet the following criteria:
● Submitted in R script (.r file format). Only .r file format will be accepted.
● Each line of code must be commented. (Explain why do you execute this line of code, not what the command does).
● Code must be runnable on any computer. Any errors in executing R code will results in significant points deduction. (Follow the guidelines provided in the class and user R code examples provided in Canvas)
3. Submit dataset(s) used in the research.
Assignment Summary
Use the College dataset from the ISLR library to build a logistic regression model to predict whether a university is private or public.
Instructions
1. Import the dataset and perform Exploratory Data Analysis by using descriptive statistics and plots to describe the dataset.
2. Split the data into a train and test set – refer to the Feature_Selection_R.pdf document for information on how to split a dataset.
3. Use the glm() function in the ‘stats’ package to fit a logistic regression model to the training set using at least two predictors.
4. Create a confusion matrix and report the results of your model for the train set. Interpret and discuss the confusion matrix.
5. Which misclassifications are more damaging for the analysis, False Positives or False Negatives?
6. Report and interpret metrics for Accuracy, Precision, Recall, and Specificity.
7. Create a confusion matrix and report the results of your model for the test set.
8. Plot and interpret the ROC curve from the data standpoint.
9. Calculate and interpret the AUC from the data standpoint.
2021-05-08