Econ 1510 Spring 2021 Midterm 2
Econ 1510 Spring 2021
Midterm 2
1. (15 points) Suppose you have data on Y and X. You specify the following regression model
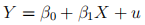
and obtain the following results from OLS
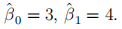
You then add 10 to the Y data. That is, you create
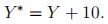
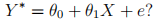
What will be the estimated regression coefficients  and
and  when you estimate the model
You must formalize all the steps that justify your answer.
2. (15 points) Suppose you have a random sample from  , and you want to learn about
  in the following regression specifications:

We know from the class that when you estimate using OLS, and assume that 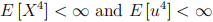 , we have that
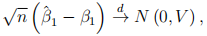
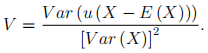
where  is the OLS estimator of , and
Suppose the data comes from a valid experiment, so we know that u is fully independent of X.
(a) (8 points) How would this extra-information (u being fully independent of X) would affect the form of the asymptotic variance V ? Please state all the steps of the calculations that justify your answer.
(b) (7 points) Propose an estimator for V that fully exploits this additional informa-tion that u is fully independent of X.
3. (15 points) Vanderbilt does a study and discovers that: a) the average Vanderbilt master student receives a salary of $100,000 per year 6-years after receiving a master degree (which is 2 years after receiving an undergraduate degree); b) the average Vanderbilt undergraduate who does not go on for further education receives $60,000 6-years after receiving a Bachelor’s degree. This difference is statistically significant at the 1% level. They conclude that the master degree dramatically increases future earnings compared to a Vanderbilt undergraduate degree.
(a) (5 points) Carefully discuss whether or not their conclusion is correct. When discussing it is always helpful to provide examples of your reasoning.
(b) (5 points) Using a sample of BA’s graduates from Vanderbilt and graduates from the master program someone estimates the following model:

where Salaryi is the annual salary a student receives 6 years after their BA graduation and M asterGradi is a dummy variable taking the value of 1 if the student was a Master graduate. Given the information provided above, what point estimates they will obtain for β0 and
(c) (5 points) The Vanderbilt alumni board was able to obtain more information on this sample and they were able to run the following regression:

where Female is a dummy variable that takes value 1 if female, Age is a continuous variable representing the student’s age, GPA is the final GPA from their undergrad tenure, FamilyIncome is the annual family income of the student at the time of graduation. Once this regression is estimated, they obtain a
4. (15 points) A researcher plan to study the causal effects of police on crime, using data from a random sample of U.S. counties. He/She plans to regress the county’s crime rate on the per-capita size of the county’s police force.
(a) (8 points) Explain why this regression is likely to suffer from omitted variable bias, making sure the arguments you provide are mathematically formalized. Which variables would you add to the regression to control for important omitted vari-able?
(b) (7 points) Use your answer to part (a) to determine whether the regression will likely overestimate or underestimate the effect of police on the crime rate. That is, do you think
5. (40 points - you must use R Markdown to answer this question). The file birthweight-smoking.dta contains data for a random sample of babies born in Pennsylvania in 1989. The data include the baby’s birth weight together with vari-ous characteritics of the mother, including whether she smoked during the pregnancy. Below we present the description of its variables.
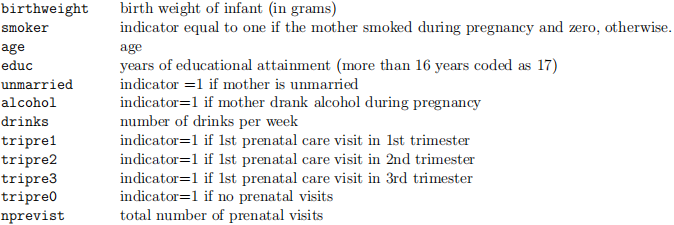
In this exercise , we want to investigate the relationship between birth weight and smoking during the pregnancy.
(a) (5 points) Load the dataset into R using R Markdown, and make sure to load all the relevant libraries for the analysis.
(b) (5 points) Check if age, educ, unmarried, alcohol, drinks, tripre0, tripre1, tripre2, tripre3 and nprevisit is balanced between mothers who smoked and mothers who did not smoke during the pregnancy. You must report the mean of these variables among non-smokers, the difference between the average of these variables between smokers and non-smokers, and their associated heteroskedastic-robust standard errors.
(c) (5 points) Based on the results of part c, produce a nice-looking table (with appropriate captions/labels ) using stargezer.
(d) (3 points) Discuss the results from part (b)-(c). Do you find any imbalance between these variable? What are the implications for your findings?
(e) (5 points) Run a regression of birthweight on the binary variable smoker and interpret your results.
(f) (2 points) Would you be able to attach a causal intepretation to your results in part (e)? Justify your answer.
(g) (5 points) Next, we want account for age, educ, unmarried, alcohol, drinks, tripre0, tripre2, tripre3 and nprevisit when estimating the effect of smoker on the binary variable birthweight . Towards this end you decided to consider the following regression specification:

Estimate the coefficients of the the above regression using OLS, and interpret your findings for the estimate of β.
(h) (5 points) Produce one well formatted table including the regression results from part (e) and (g).
(i) (5 points) Can you interpret the regression results as from part (g) as causal effects? As always, be specific in your answers and provide all the mathematical steps that justify your conclusion
2021-05-07