RMHI/ARMP Assignment 2021
RMHI/ARMP Assignment 2021
Hello everyone! This is the description for the assignment, which is due on Canvas on Monday May 3, 2021 before 8am. You’ll need to submit a Word-knitted version of the completed R Markdown file found in this zip file, according to the following instructions:
1. Rename the document called assignment.Rmd as studentID-assignment.Rmd. This is your R Markdown file, where you’ll be putting all your code and answers.
2. Replace **Your name, Student ID** at the top of it with your name and student ID.
3. While we encourage collaboration in tutorials and learning in general, you should not be collaborating with anybody AT ALL for this assignment. That means sharing code privately or publicly; even talking in the abstract about problems will effectively be collusion. You should be completing it independently, with no help from any other person in any capacity. Of course, as always, you are free to use any of the resources from the class to help you, and you're also free to google or look anything up that you like (as long as you aren't asking anybody, including anybody on discussion boards, specific questions about this assignment).
4. Plagiarism check is enabled and you can check the similarity report on your submission. However, please understand that we will not be naively looking at the overall % figure: with this sort of assignment a certain amount overlap is inevitable, so don’t worry if you get what looks like a high % score. Probably most people will. We will be using the plagiarism check for the parts of the assignment where we'd expect some variability, and to give a general sense of the overall gestalt.
5. Complete all of the problems below in the R Markdown document. Do not change any of the arguments to the code chunks, like the names of the code chunks or where it says echo=FALSE or whatever. If a problem asks you to display a tibble or variable so it shows up in the knitted version, make sure that you do as the marker cannot evaluate it without seeing it, and if they can't see it then they won’t be able to award you points for it! Remember that to display a tibble (or any variable) you just type its name on a line of its own within the R chunk.
6. I've structured this so that, as much as possible, questions do not build on each other. That means that if, say, you can't get Q5 then you can still get Q6. Try to do all of them.
7. Go for partial credit! Many of these questions have some form of partial credit possible. What that means is that if it is asking for some R code, break down the problem into pieces. Even if you can only do some of the pieces, or do them part of the way, that will be worth something. [Note that there is no question-by-question rubric available because designing one would mean giving away the answers. In general we will give full credit for responses that correctly address all of the parts of the question.] Short answer questions (SAQs) are also worth partial credit and are generally asking for some thoughtful interpretation. If it is based on a previous graph or test you've done, if you did the first part wrong but discuss it well, you can still get most or all points for the SAQ part.
8. If the question is an SAQ, it specifies a word count. Unfortunately, there is no way that I know of in R Markdown to do a word count. You need to either calculate it from the knitted document, or type up your answer in Word1 and then cut and paste it into the R Markdown file. (Please put your answer in between the word ANSWER and [Word count: XX]; needless to say, those two bits do not count towards your word count.) I know that's annoying; sorry. Anything else I thought of, like specifying a number of sentences or having no limit, was worse in terms of equity across students. The word counts I've specified in each question are designed to give you a guideline about the maximum amount of words you should need answer completely and correctly. So don’t feel like you must use all of the words; if you can answer it fully with less, that’s fine. It’s okay to go over the word limit for individual questions as long as the total word count for all of the questions is less than 1650 words (i.e., 1500+10%, with the standard penalty if it goes over that).
9. There is no word count for code chunks. Word count only applies to the SAQs. Remember to report your total word count for the assignment as a whole at the top of the document. Your total word count is the sum of the word counts for all of the SAQs.
10. You'll be turning in the knitted output of your R Markdown file. We prefer that you knit to Word but if you can't get Word to knit then html is okay. In the worst case, you can turn in the completed Rmd file. We highly, highly recommend that you knit as you go: (a) knitting can identify problems in your code that you would have otherwise missed; and (b) you do not want to get close to the deadline and think you’re done only to find that you’re having troubles knitting. Save yourself the panic and knit often.
11. Similarly, you can turn in the assignment multiple times, so I highly encourage you to turn it in even before it’s perfectly polished. That will save you last-minute panic or computer issues. Also, take a screenshot for proof of having turned it in just in case you need it.
The story of LFB and Foxy
For this assignment, we're going to go back to meet up with LFB and Foxy and hear their story. As you'll recall, a few weeks ago they, Doggie, and Flopsy went on a mission to Otherland to steal some of their data. The mission was successful but LFB and Foxy went missing! In your assignment we get to see what happened to them.
* * *
LFB and Foxy are acting as lookout as Doggie and Flopsy enter the building. Standing on one side of the building, LFB is squinting through the darkness trying to see when she hears a rustle. Then another one, then another one, coming ever closer. Not wanting to raise the alarm prematurely, LFB holds still, but when she hears another rustle only meters from where she is, she whistles, giving the signal.
Foxy dashes around the building as quickly as she can, just in time to see the bushes near LFB part. She catches a hasty glimpse as three very large shapes -- bears? dogs? something else? -- jump out at LFB. Startled, LFB whistles as loud as she can, but it is abruptly cut off by one of the animals covering her mouth.
Forgetting her normal shyness, Foxy shouts "stop!" as loud as she can and charges at the two creatures. She growls at them, surprising herself, and they turn. She trembles: one of them is the largest bear she has ever seen, but it's too late to go back now. She growls again, and then the bear rushes at her and hits her and she is knocked unconscious.
After a short and frightening journey through the dark, LFB and Foxy are put into a small, bright room. LFB is relieved to see Foxy start to stir after a moment — she hasn’t been hit that hard, then — and the two of them cuddle together in fear. The room they are in looks like a library, but it has very large chairs and books. LFB has to jump just to get down from the high sofa and reach the door handle. It is locked.
After about a half an hour of worry, the door opens and seven people come in. The first is an enormous bear, larger than anybody LFB has ever seen; she suspects that is the main person who subdued them. He is followed by an owl, a small unicorn with a rainbow mane, a hippo, and a cute penguin carrying a snake. The entire group is trailed by what looks, to their astonishment, to be a sentient guitar (that's right, a musical instrument that can walk and talk). This is a very strange place, thinks LFB.
Q1 [5% of total mark]
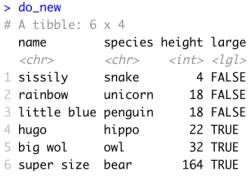
The seven strangers introduce themselves. The tibble do, which has been loaded for you in the R Markdown document, contains the information about them that LFB and Foxy have gleaned. Each row is one of the seven individuals, and the four columns are as follows:
name: the name of that person
species: the species of that person
colour: the colour of that person
height: the height of that person in centimeters
Take do and use all of the functions select(), mutate(), filter(), and arrange() to create a new tibble that (a) does not contain the variable for colour; (b) has a new variable called large which is TRUE if that animal has a height greater than 20; (c) does not include the row with the guitar; and (d) arranges the rows in order of height. Assign this to a tibble called do_new and make sure that the tibble is visible when you knit your document. do_new should look like this:
* * *
LFB and Foxy are both feeling a little calmer now that it appears nobody is going to try to kill them on sight. Still, the Others seem rather suspicious (not that that is surprising, really).
“What are your names?" the giant bear, Super Size, asks.
"LFB," says LFB, trembling.
"What kind of name is LFB?" asks Kevin, the guitar.
LFB bites her tongue and narrowly avoids asking what kind of guitar is named Kevin, and just says "It stands for Lovable Fluffy Bunny. My mum named me."
The unicorn shakes her tail and says "It's a lovely name. I like it," and glares at Kevin.
“How about hers?” the snake hisses, pointing at Foxy.
“She can answer for herself,” Foxy says, bristling a bit. “My name is Foxy. Because I am a fox.”
“Okay, okay,” says Hugo the hippo. “That’s fine. Are you okay? We didn’t mean to hurt you when we captured you, we just didn’t want to let you get away.”
Mollified, Foxy nods. “Head hurts a bit but I’m okay.”
"What are you doing here?" the giant owl interrupts.
Trading back and forth, LFB and Foxy tell everyone the whole story -- how they fear they are running out of food, and they wanted to see if the Others were stealing it (at this point LFB trembled a little bit more, and Foxy gave her a reassuring hug) or were having similar problems. As they get into the story, they can't help but noticing that most of their listeners seem stunned. The penguin whispers to the unicorn and the giant bear several times during the explanation. When they stop, there is a long silence.
"How do we know you're telling the truth?" the snake, Sissily, finally asks.
"I... don't know," LFB says. “We are, I swear."
"Rainbow and I have an idea," says the penguin. "We can take them into separate rooms and ask them the same questions about details of their story. Since they’ve had no time to collude on all those details, if they agree with each other, that means they are telling the truth.”
“That’s a good idea,” says Kevin, glaring as well as a guitar can glare. He is obviously still very suspicious.
Super Size beckons to Foxy to come out of the room with him, who glances at LFB in apprehension. What if they’re lying and plan to hurt us? she worries, but then realises that they could do that anyway. She swallows and pads after Super Size, and is somewhat relieved to see that the penguin comes with them too. The penguin — Little Blue — seems nice, Foxy thinks hopefully.
Seeing Foxy go, LFB swallows past her fear and faces the rest of them. “Go ahead and ask,” she says steadily, a bit nervous. She doesn’t mind questions, but never have the stakes been so high!
It turns out that there are fifty questions, all yes/no. They include things like “did you cross any rivers on your way here?” and “was the building we found you in the first one you went into?”
Q2 [4% of total mark]
In 125 words or less, pick one of the kinds of reliability (e.g., test-retest, inter-rater, or internal consistency) and explain how you would evaluate these questions with respect to that kind of reliability. (Note that you can propose collecting more data if you need to). In your answer, clearly indicate what kind of reliability you have chosen, what it entails, and what your proposal involves.
Q3 [6% of total mark]
It turns out that they gave the same answer to 38 of the 50 questions. (a) What is the probability that exactly 38 of the 50 answers would match if they were completely guessing? (b) What is the probability that 38 or more of the answers would match if they were completely guessing? (Hint: you’ll need to decide which of the distributions and arguments discussed on Week 5, Day 1 apply to this situation, and use R in the code chunk to make these calculations). Fill out the blanks in the answer spaces provided.
* * *
The Others confer a bit, and realise they were a bit silly to give Foxy and LFB yes/no questions, since chance performance is so high; as a result, they don’t do a great job of distinguishing whether they really were in agreement or not. They thus devise another test, this time with 50 multiple choice questions. Each of the questions has four possible answers (A through D). They have set it up so that adjacent answers are similar: this means that if (for example) LFB answered B and Foxy answered C, that those answers are closer to each other than if Foxy had answered D.
The tibble dt, which has been loaded for you in the R Markdown document, contains answers to the questions LFB and Foxy were asked. Each row corresponds to one question. The four columns are as follows:
question: the question number
foxy: Foxy’s answer to that question (A, B, C, or D)
lfb: LFB's answer to that question (A, B, C, or D)
agree: “yes” if their answers were the same, “close” if they were within one, and “no” if further
Q4 [3% of total mark]
Take dt and make a table showing how many questions LFB and Foxy give the same answer, close to the same answer, or not the same answer on. Assign this table to the variable agreementTable and make sure it is visible in your knitted document.
Q5 [7% of total mark]
The research null hypothesis in this situation is that the amount of agreement between LFB and Foxy is what you would expect to see if they were just guessing in their answers to the questions. This corresponds to expecting 25% of the answers to be coded “yes”, 37.5% to be coded “close”, and 37.5% to be coded “no.” (You can work out for yourself why this is if you’re curious, but that’s not part of the question; just take it on faith if you like). Use the appropriate statistical test (i.e., one of the ones you learned in Week 6 or Week 7) to evaluate this hypothesis. Report on the results in 125 words or less. In your answer, don’t worry about including descriptive statistics but do include an explanation of which statistical test you used and what hypothesis is being tested, the appropriate stats reference, and the interpretation of this result: based on it, what should the Others conclude about whether Foxy and LFB were just guessing when they answered the questions?
Q6 [3% of total mark]
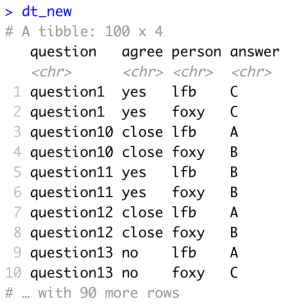
Use a pivot command to convert dt to a tibble called dt_new that looks like the one below. Make sure that the top rows of the tibble are visible when you knit your Markdown document.
* * *
After all of this, most of the Others (aside from Kevin and Sissily) are eventually willing to trust Foxy and LFB. Following a long, whispered conference amongst each other, Rainbow the unicorn steps forward and unties them.
“Sorry for our suspicion. We’ve been having food problems ourselves," she confides quietly. "We haven't known what to do about it, and are pretty worried."
"Maybe we could help?" LFB offers. "I mean, I don't know much, but perhaps if we compare problems we'll be able to figure out what's going on. We can tell you what we know about our situation too."
Foxy nods and shares the survey data we saw in previous weeks. The Others share their food data that you went over in the tutorials, and everyone agrees that there is a problem.
"The thing is," Super Size observes (everyone is now very companionable and speaking frankly), "I fear that this is having a lot of bad indirect effects on everything else. People are more irritable and fighting more, they’re sick more often, and things like that.”
"Do you have any data about that?" LFB asks, curious.
There is a long silence, and then Little Blue volunteers: “We could check their budgets and health records to see.”
Everyone is enthusiastic, and the next day — after they find the data, have a long sleep, and share a companionable dinner with their new friends — everyone gathers around. The data is in the tibble called db, which has already been loaded for you. It contains the following columns:
name: the name of each person
species: the species of the person
size: the size of the person (small, medium, large, enormous)
time: first or second time point (each person contributed two rows to the dataset, one for each)
weight: that person’s weight in kg when they visited the doctor at that time point
budget: that person’s food budget that month
"How far apart were the two time points?" Rainbow asks after they all take a look.
“About six months,” says Little Blue. "Time point 2 was last month, and time point 1 was about seven months ago.”
Q7 [6% of total mark]
(a) Use the group_by() and summarise() functions to calculate the mean and median weight and budget at times 1 and 2. (In other words, the resulting tibble should have two rows corresponding to each of the two time points, and five columns called time, meanWeight, mdnWeight, meanBudget, and mdnBudget). Put the results in a new tibble called db_sum and make sure that db_sum appears in your knitted document. (b) Based only on the mean and median values, which variable (weight or budget) do you think most closely follows a normal distribution at time point 1? Explain why in no more than 50 words.
Q8 [7% of total mark]
A long form of the dataset db, called db_long, has been loaded for you. It combines the values for weight and budget into a single column called value, with another column called measure denoting which variable (weight or budget) that value corresponds to. Use db_long to make a figure that shows the 1D distribution of each of the two measures (weight and budget) using whichever geom seems appropriate to you.2 There should be two panels in the single figure, one for each measure, with the x axis corresponding to the value of each measure. Make sure the different measures have a different fill colour (using a palette of your choosing, as long as it’s not the default) and are outlined in black. Title and label the axes appropriately (there is no need for a subtitle). Remove the legend if it is redundant, use a nice theme, and make sure that the scale of the x axis is allowed to vary between the two panels based on the values of each variable (i.e., the scale shouldn’t be fixed in the same way for both panels). In no more than 75 words, explain which of the two measures looks least normal, and discuss whether you think this is an accurate reflection of how people’s weights and incomes/budgets are distributed in our world.
Q9 [5% of total mark]
Instead of just guessing based on the figures whether the two variables (budget and weight) are normal, perform a statistical test to determine this. (Don’t worry about performing different tests for different time points for each variable; you only need one for each variable, combining both time points. In other words, you should perform one test for budget and one test for weight, not separate tests for budget at time 1 and time 2 or weight at time 1 and time 2). In no more than 75 words, report the statistical test used and then for each variable report the statistical reference and interpret whether that means the variable is normal or not.
* * *
At this point, LFB looks more closely at the data. "There is a sentient string in Otherland?" she asks incredulously.
Kevin looks up, miffed. "That's my best friend, Kevin Clark," he says. "What, do you think a string can't be intelligent? Or a guitar?"
"No, no, just curious," LFB backpedals hastily. "All good."
Rainbow whispers to her, "We don't understand it either. Just go with it."
Super Size clears his enormous throat. "Ahem. So now you have a sense of our dataset. That's reasonably representative of Otherland, I would say."
Sissily nods. "Yes. Mostly birds, bears, and bunnies, with a bunch of other things too."
“This is super fascinating,” Foxy interrupts, “but let’s see if things have been changing for you all the same way they have for us. Are you also running out of food in ways that impact people?”
Q10 [6% of total mark]
As a first step to answering Foxy’s question, let’s graph our data: specifically, let’s focus on weight. Using whatever geom seems appropriate to you for this task, make a figure that compares the weights at the first time point to the weights at the second time point. There should be only one panel, but you should use two different geoms: one that shows each individual data point, and one that shows some sort of summary of them. (The x axis should show the first and second time points, and the y axis the weights). Make the individual data points slightly transparent so that you can see both geoms, and make it so the time points are coloured differently (using the same colours for both the individual data points and the summary, but a different palette than in Q8). Title and label the axes appropriately (there is no need for a subtitle). Remove the legend if it is redundant.
* * *
"What we really want to know is if any of this is significant," says Super Size. “Has the average weight really dropped between time points 1 and 2?”
"To do that we need to run a statistical test," says Sissily.
Q11 [7% of total mark]
Use the appropriate statistical test (i.e., one of the ones you learned in Week 6 or Week 7) to evaluate whether there has been a significant change in weight from the first time point to the second. Report on the results in 125 words or less. In your answer, don’t worry about including descriptive statistics but do include an explanation of which statistical test you used, the appropriate stats reference, and the interpretation of this result.
Q12 [9% of total mark]
A wide form of the dataset db, called db_wide, has been loaded for you. It contains only the values for weight, and has split the two time points into two columns (called first and second). It also has a new variable, diff, which contains the change in weight from the first to the second time point: if diff is 0 this indicates no change, if diff is -1 this indicates that the individual lost 1 kg, and so forth. Perform a one-sample t-test on diff to determine whether it is significantly different from zero (don’t worry about checking any assumptions) and report your result, including the stats reference, the effect size, and the interpretation thereof. Does this result relate in any way to your answer to Q11? If so, why? If not, why not? Your full answer should take no more than 150 words.
Q13 [8% of total mark]
Make a figure of your own using any forms of the dataset, with the goal of learning something new about the data that hasn't been shown by the previous plots. Requirements: (a) it needs to involve a geom other than one of the ones you used before; (b) it needs an informative title and axis label; (c) it should involve more than one facet; (d) it should be clear and aesthetically pleasing; (e) you should explain in no more than 125 words what the graph suggests about the data. In your explanation be sure to describe the variables on each axis as well as what the pattern is and what it suggests about what is going on for our friends. Feel free to go beyond these requirements if you like (e.g., you can use more than one geom, subtitles, etc) but it is not necessary to get full marks.
Q14 [8% of total mark]
A form of the tibble db that contains only data from the first time point, called db_first, has been loaded for you. The distribution of responses to the budget question in that tibble represents the sample distribution of budget and its mean is the sample mean. Suppose the true distribution of budgets in Otherland is highly skewed, with most people having relatively low budgets and a long tail of relatively few very rich people with higher budgets. (a) Given this, what can you say about the approximate distributional shape that you would expect the sampling distribution of the mean to have, and why? (b) In the code chunk, calculate your best estimate of the mean and standard deviation of the sampling distribution of the mean, given that the sample size in this dataset is 31; report your result in the answer space. (c) How does the standard deviation you calculated in part (b) relate to the 95% confidence interval, and why? Your full answer should take 200 words or less.
Q15 [3% of total mark]
Suppose you ran a chi-squared test with n degrees of freedom and calculated
2021-04-29