Programming Project 4 Spring 2021
Programming with Python
Programming Project 4 Spring 2021
● This assignment is an individual assignment.
● You must write your code in a Jupyter notebook and submit the completed notebook.
● write your name, course No, and assignment number in the very first cell of the notebook. Your name must also be in the filename of the notebook.
● Your work should look professional. All output should have a message. Every chart should have a title, etc.
● For each question, introduce a cell of Markdown, where you must write down the question number and optionally more. No need to copy and paste the question. Question Number is good enough
● You must answer each question by using Python / Pandas. Not by eyeballing! You may use any feature or method in python or pandas, even methods that I have not yet introduced in the class. Feel free to explore the pandas cheatsheet.
● In the cell where you import libraries, include the option shown below. This option will make pandas display fractions with two decimal places. It does not round the number. The precision of the data stays the name, but only 2 decimals are shown at display time.

1. Include an image at the top of your notebook. Preferably, related to Fordham university. Adjust the image size to look good. No credit if you use any images included in my lecture notes. Ha Ha!
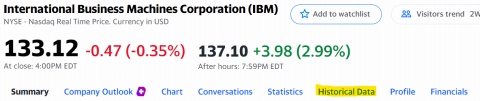
2. Go to yahoo. Finance and download 6 months of historical trading data of IBM (October 20th, 2020 - April 19th , 2021 both dates included)
The image below was taken on the night of 19th April 2021.
3. Read the data in Pandas and store as a DataFrame.
4. Before you use the data, you must perform a due diligence check of the data. i.e. Check all attributes of the dataframe. Make sure to check and know the data type of each column.
5. Are there any missing values in any of the columns? Explain your answer.
6. Rename all column names to be in lower case. Make sure there are no spaces in column names. For each of the remaining questions, write python/pandas code, get the answer, and then write down your answer in English using markdown.
7. It is more useful to have trading date as the index of the DataFrame. Change the index.
8. Create a new column called day_range in which you store the difference between the High and Low price on each day. Is the day_range always nonnegative?
9. The trading volume numbers are in millions. Scale the trading volume to be in thousands of shares.
Ex: 7478700 will become 7478.70 after scaling.
Hint: if S is a series, S/100 will divide every element of the series by 100. Similarly, S + 100 will add 100 to every element of S. This property is called broadcasting
10. What is the highest closing price of IBM over the 6-month period?
11. What is the date on which the highest closing price (previous question) was reached?
12. Two part question. Create Visuals (charts) to show how the closing price behaved. Choose an appropriate chart for each task. Make sure your chart looks professional.
12a. Create a Chart to show the distribution of closing price over the 6-month period. Write one or two sentences of your observations from the chart.
12b. Create another chart to show the trend over time of the closing price. Write down your observations in markdown.
13. Create a visual to inspect the relation between trading volume and closing price in the dataset. Write down your conclusions.
14. Create another chart to examine the trend in trading volume over time. Write down your observation.
15. Calculate and display the number of trading days on which the closing price is equal to or above 130.
16. What is the average trading volume over the 6-month period? Write down your answer.
17. Create a new DataFrame of the IBM stock data for the days when trading volume is above average, and stock closing price is above 125.
18. Write out to disk the DataFrame created in the previous step.
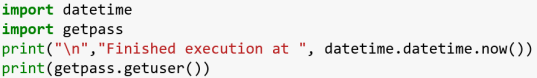
19. The last cell of your notebook must have code that displays your userid as well as the time at which the code was executed.
The next few questions are Optional. Need not submit.
20. Create a new data frame consisting of all the stock data for the month of March 2021.
21. Write out to disk an excel file with the March 2021 IBM stock data from the previous question.
22. The Closing Price and Adjusted Close appear to be the same on several days. Write pandas code check if this is True or False and explain your answer.
2021-04-29