C20NR ENVIRONMENTAL AND RESOURCE ECONOMICS
SCHOOL OF SOCIAL SCIENCES
Economics
ENVIRONMENTAL AND RESOURCE ECONOMICS
Course Code: C20NR
Date: April/May 2019
Duration – TWO hours
INSTRUCTIONS
University approved calculators are permitted.
Section 1: Short Questions
Answer any FOUR questions
Section 2: Long Questions
Answer any TWO questionsC20NR
Section 1: Answer any FOUR questions.
1. Define “common pool resource”. Illustrate using an example from environmental economics.
Good answers will describe using terminology “rival” and “nonexcludable”. Various examples possible.
(10 marks)
2. In the case of a depletable resource such as oil, explain what happens to the extraction path and the price of the resource in the presence of monopoly.
In the case of monopoly, there will be only one agent owning the resource and making the extraction decisions so it will slow down the extraction path.
(10 marks)
3. Assume that a coal plant will start to operate in the vicinity of a village. This plant produces waste that will be dumped into the river of that area causing a negative externality to the ecosystem. Illustrate diagrammatically the impact of the externality in the traditional demand-supply graph. Show and briefly explain what happens to the quantity produced and the price, and identify the welfare loss.
Figure 11.2. Pag. 214 Mankiw and Taylor class book or slide from Lecture 2 in Vision.
(10 marks)
4. What is the Environmental Kuznets Curve (EKC)? Identify and briefly describe the behaviour of the curve around its turning point.
The EKC shows the relationship between income levels and environmental quality. It was proposed by Grossman and Krueger in 1993. Growth is generally measured by the change in income or GNP per capita and the environmental quality is measured by individual pollutant emissions, index of pollutants or changes in air or water quality.
Two parts of the EKC can be identified: before and after the turning point.
Before the turning point: the economic growth increases the use of resources and land clearance, increasing waste. The economy starts from an agricultural economy to becoming an industrialized economy in which emission levels increase.
After the turning point: the increase in income increases the demand for environmental quality, government protects environment and there is a more “green” consumption, there are technological improvements that bring more efficiency, changes in the structure of the economy. Finally, the increase of “environmental quality” drives its relative price up diminishing its consumption and increasing preservation.
(10 marks)
5. Define the “Opportunity Approach” used in defining sustainable development. Enumerate and define the different forms of capital distinguished in this approach.
Answers follow Hanley et al., 2001. Chapter 6.
The Opportunity Approach to an economic definition of sustainable development considers the means available to society to generate well-being or consumption’ i.e. its resources: physical stock, technology.
Three forms of capital may be distinguished:
1) Man-made capital → comprised by the results of past production. Includes machinery, roads, bridges, phone networks, etc. Goods used for production and consumption. It can be depreciated. Investments possible.
2) Human capital → labour and includes all skills and knowledge embodied within people.
3) Natural capital → comprises natural resources, both renewable and non-renewable energy, material, biodiversity, clean air, water, etc. It can be depreciated. Investments are replanting and restocking of fisheries.
(10 marks)
6. Gross Domestic Product (GDP) has been widely criticized as a measure of well-being. What are the main criticisms of GDP?
- The GNP does not measure well the effect of the economy on the environment. Several possible examples.
- Changes in the natural resource stocks are not considered in the NDP. For example, depletion of resources or natural conditions.
- GDP does not tell us how the economic product (economic pie) is divided. GNP per capita could increase, but income inequalities could worsen.
- GNP does not include changes in factors such as health and literacy, which are key elements in people’s well-being.
(10 marks)
Section 1 Total – 40 marks
Section 2: Answer any TWO questions.
Question 1
Suppose you receive an oil well from which you can obtain 30 barrels of oil. The marginal cost of producing the oil is constant and equal to $4. Assume you have only 2 periods to extract the oil (today and tomorrow). A study has found that the demand for oil in each period is:
MB = 35 – 0.25q
where q is the quantity extracted. MB = Marginal benefit = demand.
(i) Assuming that you can only invest the money in the bank, calculate the extraction path of the oil. Assume an interest rate of 10% and a competitive market. How does this extraction path differ from the case of infinite resources? Explain briefly the major reasons for these differences.
Equal MB with MC (MC = 6) and assume that Q = q1 + q2. Then, q1 = Q – q2. Then solve for q1 and q2 and the result is: q1 = 20 barrels and q2 = 10 barrels. It differs because of the limitation of resource = scarcity.
(15 marks)
(ii) Calculate the price of a barrel of oil you expect to collect in each period. Compare those prices with the given marginal cost (which would be the price for an infinite extraction horizon) and explain why they differ.
Replace the values of q1 and q2 into the equation of the marginal benefits and the results obtained are: p1= $30 and p2= $32.5. We can see p2>p1 and the reason of the difference is the scarcity rent, as it is a depletable resource and in q2 quantity goes down, then price goes up.
(9 marks)
(iii) Calculate the total benefit you will obtain in each period.
Multiplying price and quantity for each period we obtain: B1 = $600 and B2 = 325.
(6 marks)
Total: 30 marks
Question 2
Answer both (i) and (ii) below respect to the topics of fisheries.
(i) Is the maximum sustainable yield synonymous with efficiency? Illustrate your answer with a diagram.
No, because it in that point benefits are not maximized. The efficient point is given by a lower effort at the point where the benefits minus costs are maximized. Complete answers should follow the book of Tietenberg, chapter 3, pag. 323-324.
(15 marks)
(ii) Imagine that there is an external shock affecting the salmon fishing industry which increases the marginal cost of fishing. What will happen to the sustainable yield equilibrium? Specify the effects on the level of effort, population, annual catch and the net benefits derived from the fishery. Illustrate your answer with a diagram.
The total cost curve will move towards the left. Graphical analysis needed. The effort will decrease, the population level will increase, the annual catch will be lowerr and the net benefits will decrease.
(15 marks)
Total: 30 marks
Question 3
In order to estimate the value of the externalities of renewables generation in Sweden the environmental authority conducted a choice experiment study and obtained the following results:
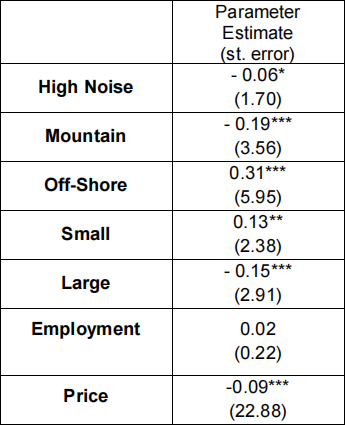
*** = variable significant at 1% confidence level.
Results from a multinomial logit model. Dependent variable is the utility
level derived from the alternatives presented in a choice set (twogeneric alternatives of renewable energy plans).
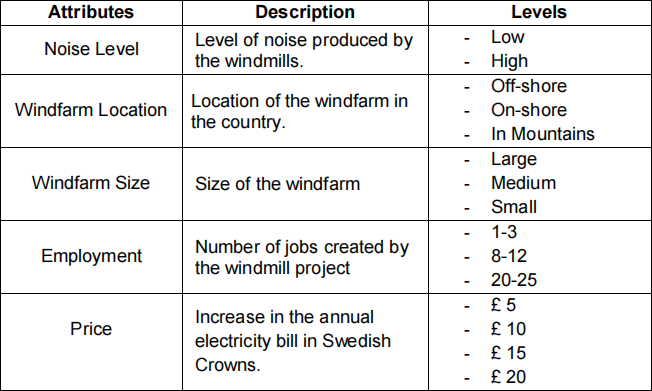
Description of the attribute levels
(i) Calculate the marginal willingness to pay of respondents for the significant attributes. Can you calculate the total value of the externalities from windpower generation with this information? Explain your answer.
Marginal willingness to pay:
High Noise= € 0.66
Mountain = € 2.11
Off-Shore = € 3.44
Small = € 1.44
Large = € 1.67
Yes, I can calculate the total value of the wind power externalities with this information by adding all the marginal values. However, generally choice experiments include only a limited number of attributes and therefore we may obtain an under-valuation of the externalities.
(10 marks)
(ii) The study considers three possible locations for wind farms. Rank these locations from the most to the least preferable to respondents and explain your answer.
1st – Off-Shore
2nd – On-Shore
3rd – On Mountains
Full explanation should include analysis of sign respect to the baseline. C20NR
(10 marks)
(iii) Imagine you are a consultant for the Swedish Government and you get the results of this study. What recommendations would you suggest to the Swedish Government regarding the design and implementation of future windfarms for energy generation in the country?
Prefer windfarms or projects:
- Located off-shore.
- Minimize the size.
Minimize the increase in the price of the electricity.
(10 marks)
Total: 30 marks
Question 4
The following table presents part of the results of a contingent valuation study that elicits the willingness to pay for generating electricity by using renewable energy sources (RES) instead of hydropower and fossil fuels. Note: Results are taken from the paper of Aravena et al., 2012.
Aravena, C.; Hutchinson, G. and Longo, A. (2012) “Environmental pricing of externalities from different sources of electricity generation: Evidence from a contingent valuation study in Chile”. Energy Economics, 34, 1214-1225.
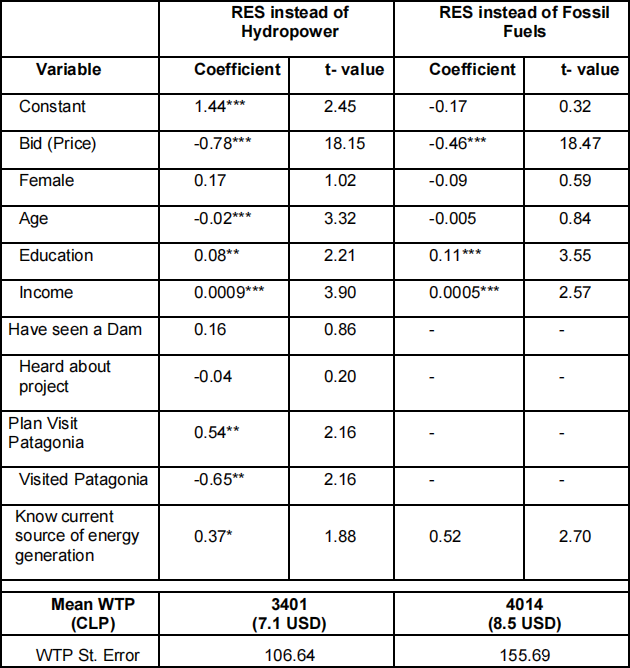
*** Statistically significant at 1%level; ** Statistically significant at 5% level; * Statistically significant at 10% level
Note: WTP = Willingness To Pay; CLP = Chilean Pesos; USD = US Dollars.
(i) Considering these results, what can you conclude about the effect of age and income on the willingness to pay for renewable energy sources in Chile?
Age has an effect only in the case when the status quo is hydropower. Younger people are willing to pay more for RES in order to avoid externalities caused by large dams. People with higher income are willing to pay more for renewables instead of traditional sources such as hydropower and thermoelectric.
(5 marks)
(ii) Considering the willingness to pay for the different scenarios (WTP). Imagine you are a consultant for the Chilean Ministry of Energy, which is looking for input to decide on the policy to support different energy sources in the country (Remember options are hydropower, thermoelectric and renewables). What is the ranking of energy sources you would suggest to the Ministry of Energy? Explain clearly your selection.
Ranking: i) RES ii) Hydropower iii) Thermo-electric.
Explanation should include the analysis that the WTP for avoiding the externalities caused by a thermoelectric plant is higher than the WTP to avoid the externalities generated by the large dams and therefore people prefers hydropower with large dams over fossil fuels.
(10 marks)
(iii) Assume that a valuation study has been performed and has found an aggregate WTP for renewable energy sources instead of fossil fuels of US$ 4,800 million for the next 20 years. The Chilean Government has been informed that the cost of producing the additional energy needed by the country with fossil fuels for that period is US$ 6,100 million. On the other hand, producing the same amount of energy with renewables would cost US$ 8,000.
Imagine again you are a consultant for the Chilean Ministry of Energy. Explain the economic meaning of the obtained value of WTP. Using the information of costs and WTP provided above, inform the Chilean Government about the way you would use the WTP value and what alternative of energy generation the Government should choose for providing energy to the country the next 20 years. Finally, propose and design the policy instrument needed to implement the chosen alternative. Explain clearly your choice and the design of the policy instrument.
- WTP represents the value of the externalities from fossil fuels.
- This value is used to introduce in a cost-benefit analysis as the social cost or the cost of externalities not considered in the private cost of US$ 6,100.
- Cost benefit analysis:
o Total cost of fossil fuels: 6,100 + 4,800 =10,900
o Total cost of RES: 8,000C20NR
- Therefore, RES become more competitive and that is the option the Government should choose.
- Policy instruments: mix of household levy with RES subsidy or tax to fossil fuel producers.
- Calculation of the levy: 8,000 – 6,100 = 1,900 → We then use this as the flow in the present value, using a discount rate we calculate the present value, disaggregate by the relevant population, divide by 20 years and then by 12 months to calculate the monthly amount of the levy.
(15 marks)
Total: 30 marks
Section 2 Total – 60 marks
- END OF EXAM PAPER -
2021-04-28