Project ECON 7040
Project ECON 7040
Instructions
You must submit to Turnitin a final report for the project that contains all your answers, including graphs and tables (when necessary). The report must contain a list of references used in the analysis/discussion of results. There is no page limit. However, brevity and clarity will be valued and excessively long and unclear reports will be penalized. Students also submit (to Blackboard instead) their replication data and codes.
Part A: Income Accounting (5 marks)
In this section, you are asked to repeat the analysis in Hall and Jones (1999). As seen in Lecture 5, the production function in country i is
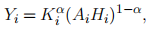
where Yi is output, Ki is capital, and Hi represents human capital. The importance of capital in production is α. Hall and Jones assume that α = 1/3 for all countries. They also assume that human capital is
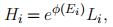
where Ei is years of schooling in country i, Li is labor, and φ(Ei) is a piecewise linear function. In particular, φ(·) implies that in the first 4 years of school, each year yields a return of 13.4%. In the next four years, each year yields a return of 10.1%, while beyond the 8th year of schooling each year returns 6.8%. The production function can be rearrange as
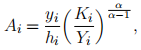
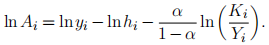
where yi and hi are per-worker output and human capital, respectively. Taking logs we have
1. The excel file “DATA_HALL_JONES_1999_QJE.xls” contains the original data in Hall and Jones (1999). For each country, we have output per-worker (yi), capital to GDP ratio (Ki/Yi), and years of schooling Ei . Your first job is to obtain, for each country, a measure of lnhi . You will need to use equation (1) and the assumptions about φ(·). Plot a graph with lnyi in the vertical axis and lnhi in the horizontal axis. What can you say about the relationship between human capital per-worker and output per-worker?
2. Now, use equation (2) to obtain a measure of countries’ productivity levels lnAi . Explain the meaning of this measure. Does lnAi vary too much across-countries? In particular, what is the mean and the standard deviation of lnAi?
3. Plot a graph with lnyi in the horizontal axis and lnAi in the vertical axis. Is the relationship between lnyi and lnAi weaker or stronger than the relationship between lnyi and lnhi? Report both correlations.
4. Pick two developing countries (call them country B and C) and compare them to Australia (call it country A). In particular, what are the ratios yB/yA and yC/yA. Then what are the ratios of all the other components (Ai,
, and hi). What is the main source of income differences between countries B and C and Australia?
Part B: Macrohistory database (5 marks)
In this section, you are asked to use the Macrohistory database. These data have a much smaller number of countries but a much larger number of years per country. First of all, familiarize yourself with the dataset and variables. All the relevant information is here: https://www.macrohistory.net/database/.
1. After familiarizing with the dataset, select a subgroup of variables that you consider are relevant to understand the drivers of countries’ GDP per-capita. To make this decision use the models we used in lectures as a guide. However, you are free to think out of the box and look for relevant relationships we have missed so far.1
2. Provide descriptive statistics on your variables (mean, median, standard deviation). Discuss how much variation overtime you observe within country. Also, discuss how much variation across countries you observe for a given year.
3. Proceed to estimate the relationship between (log) GDP per-capita or GDP growth (your choice) and the variables of interest that you selected. Start by estimating a simple OLS regression with all the countries pooled together. Interpret the coefficients of the regression and discuss econometric and economic issues behind the results. Can you make sense of the results using any existing theory? Are your results consistent with previous literature?
4. Extend the previous analysis and estimate a panel fixed-effect regression to control for countries’ unobserved heterogeneity that might shape the observed heterogeneity in GDP per-capita (growth).2 How different are the results compared to 3)? Are your results consistent with previous literature?
5. Using the econometric model in 4) investigate how the relationship between GDP percapita and your “X” variables have changed overtime. In particular, how different are the results of the model when you restrict the sample before 1945 (regression using sample 1870-1945) and after 1945 (regression using sample 1946-2016? Discuss your results from an economic perspective, considering the major economic episodes during each subperiod.
6. Finally, investigate how important is the sample of countries in determining your results. For example, do your results change substantially when excluding US or Australia or Japan from the sample? Discuss potential explanations for your findings.
2021-04-24