CENG10014 Design & Computing
Design & Computing
CENG10014
Computing Assessment Overview
Once the turbine design process is complete, wind farm layout (i.e. the locations of wind turbines within the farm) needs to be considered. The prevailing south-westerly wind is found in the summer, autumn, and winter months, while a north-easterly becomes prevalent in the spring. The Orkneys are braced by the strongest winds in the autumn and winter months and are much calmer in the spring and summer months. The specific site has substantial variability in wind conditions and therefore detailed analysis is required to determine financial viability of the project.
A wind turbine operates at its most efficient when subjected to “clean” flow (i.e. entirely uniform oncoming air). The turbine extracts kinetic energy from the wind which is ultimately converted to electricity. This process means that air downstream of a turbine will be characterised as being of a lower velocity, which is called a wake. When arranged in farms, the wake produced behind turbines moves downstream and can interact with other turbines in the farm, exhibiting those downstream turbines to “dirty” oncoming air leading to a lower overall energy production. As a result, it is ideal when designing a wind farm, where possible, to minimise the interaction of these wakes to maximise the total power produced.
For this work, you will use a modelling strategy, that has been pre-coded as a Matlab function for you and calculates the energy production for a given wind farm layout, to determine the financial viability of this project.
NOTE: all files required for this project are available to download from the unit Blackboard page.
Method
For this work, you will use the FLOw Redirection and Induction in Steady-state (FLORIS) model as a basis to analyse and design the farm. The full formulation can be found at:
PMO Gebraad, FW Teeuwisse, JW Van Wingerden, PA Fleming, SD Ruben, JR Marden, and LY Pao. Wind plant power optimization through yaw control using a parametric model for wake effects—a CFD simulation study. Wind Energy, 19(1):95–114, 2016.
The FLORIS model has been coded into a Matlab function called floris.m. There is no need to code the model yourself, and you should not change source code of the floris.m function.
You will need to download the course code from Blackboard. Detail on how to use this function is given using the HELP functionality of Matlab:
>> help floris
The function requires a number of inputs detailing the farm layout, turbine information and flow conditions. It returns the power of each turbine. It also has the option to return the value of wind speed at a certain location within the farm – this may be useful if you have been given experimental data of speed and wish to compare the model, for example.
Validation
When using any modelling method, you should always validate this against known data (this could be experimental, or just known results); for this task you will be comparing to experimental data from a small-scale wind tunnel experiment, and from a real-life wind farm.
In a wind tunnel running at 2.5m/s is a turbine with diameter 0.416m placed at location (10,0,0.3)m in the wind tunnel i.e. the turbine is 10m from the front of the tunnel, and at a height 0.3m from the floor. The turbine produces 0.536W of power. A simple power-curve of the turbine (required for the FLORIS model) is given in WT_powercurve.csv. Given in the file WT_NeutralABL_exp.csv is a series of readings of the wind-speed normalised by the oncoming wind-speed at different x, y and z locations downstream of the turbine (non-dimensional values are also given).
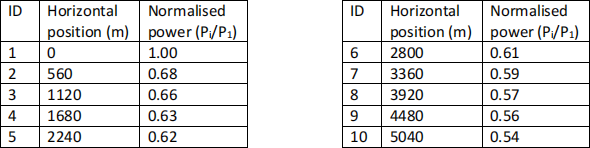
The second aspect of validation of this model is ensuring the wake interaction is occurring. To do this, we will used data from the Horns-Rev 1 wind farm in Denmark. Horns-Rev is a large farm consisting of 80 Vestas V80 wind turbines (the power curve is available in the V80_powercurve.csv file and the diameter is 80m) arranged in a grid-like shape with a maximum total output of 160MW. We are going to consider a small subset of these turbines for the sake of this process, which will be a single line of the grid. There are 10 turbines spaced in a horizontal line at 560m intervals. When the wind is blowing parallel to that line at a speed of 8m/s, the normalised power produced by each turbine is given as follows:
You should complete the following two validation tasks:
1. Using the provided model and data, compare the FLORIS model to the wind tunnel data. You will need to write a code/script that will need to read in the data from the necessary files, will need to write the appropriate inputs for the FLORIS function for the experimental set-up and suitably handle the outputs. It is up to you how you do this validation but must include at least one line graph. Ensure any graphs produced are well formatted and clearly labelled. All graphs should be included in your final report.
2. Compare the powers predicted from the model and those provided for Horns-Rev, and report the results appropriately in your final report.
Computing Task
Now that you have validated the model, it is time to integrate this within the wind farm design project. For this task, you should write an application/tool (i.e. a code) that produces a “wind farm assessment” for your final design that uses the FLORIS model you have validated above. Your code should be easy to use, with clear instructions either within the code, or as part as a separate instruction file, should be well formatted and produce clear plots and data visualisation. When run, the code will provide a “wind farm assessment”, which should include the following data and plots:
• A plot showing the layout of the wind turbines – you should decide on the appropriate form of this;
• A plot showing the wind speeds through the wind farm for one given wind speed and oncoming flow direction – this could take the form of a line plot, or a surface plot and is up to you;
• A plot or table of the expected power output through the year and expected variations;
• A plot showing the effect of changing oncoming flow direction to the power output;
• Any other data/plots you feel appropriate.
Developing this should also help you design your farm appropriately. Include the wind farm assessment plots in your final design report.
What to hand in
For the computing task, the hand-ins are:
• A section in the final report of the validation tasks with the plots requested and a small discussion on these. Do not hand-in the Matlab scripts used to produce the plots.
• A section in the final report that contains the wind farm assessment results for your final design.
• All Matlab files that make up the wind farm assessment tool you have written, including any instructional files (i.e. a README file) needed, and examples of any input files that are required. With your final submission, it should be possible to hit “Run” and it work first time unless there are errors with the inputs.
Assessment Criteria
50% of the project report focusses on computer-based modelling and is assessed under the following criteria:
1. The code meets the project objectives and runs without producing errors and plots the required outputs with appropriate formatting
2. The code is easy to understand with appropriate style, and follows sound programming principles
3. The code can handle non-standard inputs from the user without error
4. The final documentation comprehensively details the approach taken, uses appropriate figures and explains the patterns observed using appropriate technical language
2021-04-24